
Figure 2. Effect of conditioning during the learning phase of Experiment 1.
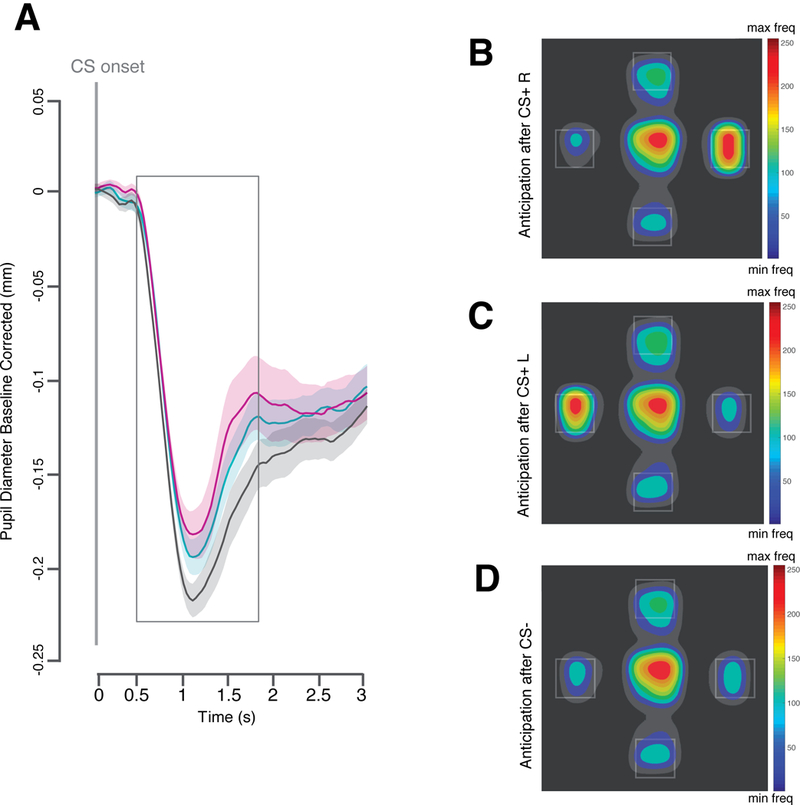
A, Plot of the averaged pupil response over time aligned to the onset of the conditioned stimulus (CS) and plotted separately for the CS that could predict either the delivery of a snack to the left (CS+ L) the delivery of a snack to the right (CS+ R) or no snack delivery (CS−). B–D, Heatmaps of the fixation patterns during the anticipation screen (normalized frequency; freq): after the offset of the CS+R (B) the CS+ L (C) and the CS− (D). Shaded areas indicate the within subject standard error of the mean. All plots are based on data from 40 participants.