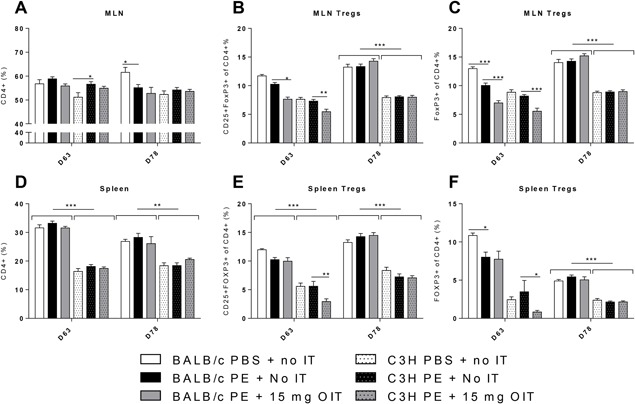
Figure 4.

Flow cytometric analysis of T cell populations in the spleen and MLN. PE sensitized mice received OIT for three weeks. On day 63 and day 78 MLN and Spleen lymphocytes were isolated. Cells were gated based on FSC–SSC properties and the Fluorescence‐minus‐one (FMO) technique. A and E, Percentage of CD4+ cells in MLN and Spleen. B and E, Percentage of Tregs (CD25 + FoxP3+ of CD4 +) in MLN and spleen. C and F, Percentage of activated Tregs (FoxP3+ of CD4 +) in MLN and spleen. All data are represented as mean ± SEM n = 6 mice/group. Statistical analysis was performed using two‐way ANOVA and Dunnett's post hoc test for multiple comparisons. *P < 0.05; **P < 0.01; ***P < 0.005; compared to indicated group
