
Figure 5.
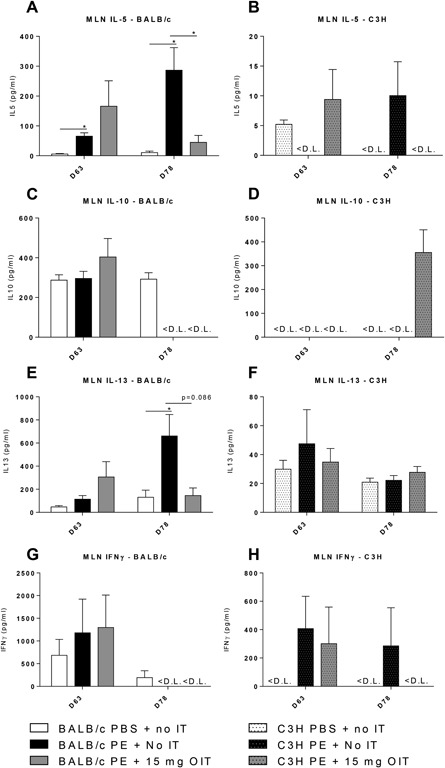
Cytokine concentrations after ex vivo stimulation of MLN derived lymphocytes with PE, determined by ELISA. PE sensitized mice received OIT for 3 weeks. MLN lymphocytes from different days were cultured for 96 h in the presence of PE or medium (medium data not shown). A and B, IL‐5 concentration. C and D, IL‐10 concentration. E and F, IL‐13 concentration. G‐H IFNγ concentration in MLN. Data are represented as mean ± SEM n = 6 mice/group. <L.D., below the limit of detection. Statistical analysis was performed using one‐way ANOVA and Dunnett's post hoc test for multiple comparisons. *P < 0.05 compared to indicated group