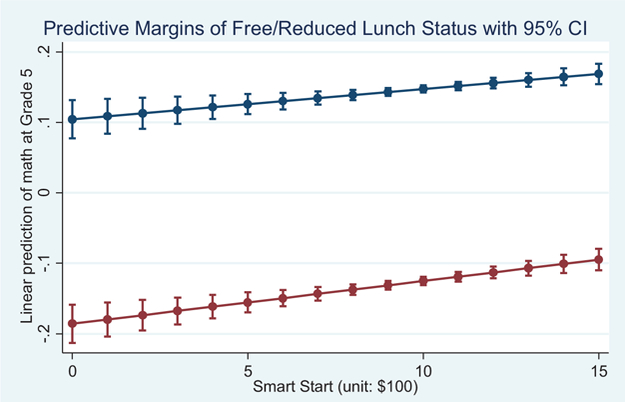
Figure 2.

Relation between Smart Start funding levels in early childhood and children’s standardized math scores in fifth grade (Dodge, Bai, Ladd, & Muschkin, 2017). Lower line is for children receiving free or reduced lunch, and upper line is for children not receiving free or reduced lunch. Error bars indicate standard error of the means. CI = confidence interval. See the online article for the color version of this figure.
