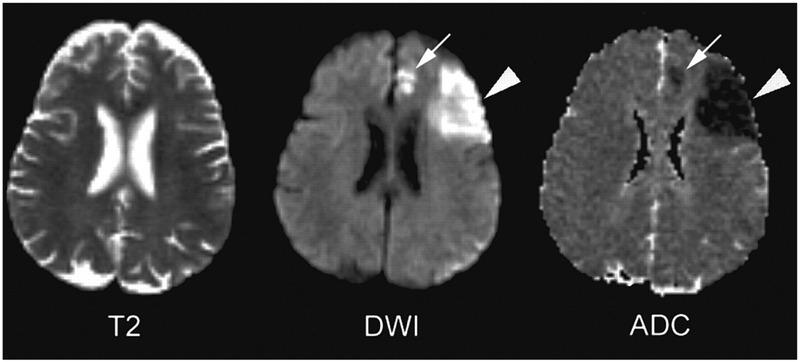
Figure 12.5.
MRI imaging modes which are used in clinical settings to visualize changes in water mobility (cell swelling) following ischemic stroke. Left panel: At early times after the onset of focal ischemic stroke, fast spin-echo T2-weighted MRI imaging has yet to show brain damage. Center panel: In contrast to the T2 imaging, diffusion weighted imaging (DWI) shows a large hyperintense area in the territories of the prefrontal artery (arrowhead) and a smaller signal in the territory of the anterior cerebral artery (arrow). Hyperintensity reflects a decrease in water mobility upon its shift from the extracellular to the intracellular space. Right panel: Apparent diffusion coefficient (ADC) of water identifies the regions of low water mobility as hypointense signals. In 2–3 days, the DWI/ADC positive areas will likely develop full infarction that will be apparent in T2 imaging (not shown). Reproduced from M.G. Lansberg et al., 1999, with permission.

