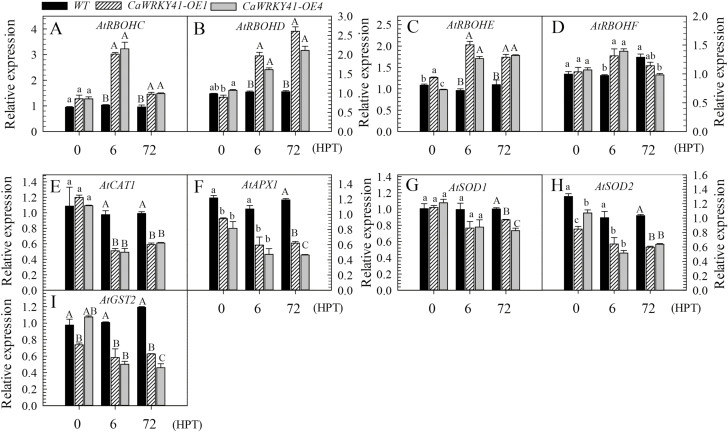
Fig. 7.
Expression of genes encoding ROS-producing and ROS-scavenging enzymes detected by RT–qPCR analysis in WT, CaWRKY41-OE1, and CaWRKY41-OE4 plants at 0, 6, and 72 h post treatment with Cd. (A–D) Expression of ROS-producing enzyme genes (A) AtRBOHC, (B) AtRBOHD, (C) AtRBOHE, and (D) AtRBOHF. (E–I) Expression of ROS-scavenging enzyme genes (E) AtCAT1, (F) AtAPX1, (F) AtSOD1, AtSOD2, and (G) AtGST2. Data represent the mean ±SE of three biological replicates. Different letters indicate significant differences compared with the control (Tukey’s test; lowercase letters indicate P<0.05 and uppercase letters indicate P<0.01).

