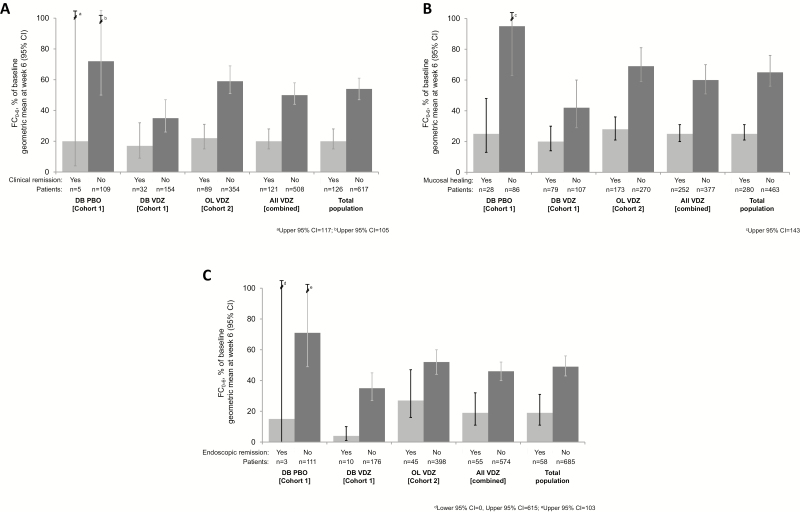
FIGURE 1.
Change from baseline in FC concentrations at week 6 (%FC0-6) by clinical outcome status at week 6 and by treatment group: (A) clinical remission, (B) mucosal healing, and (C) endoscopic remission. Error bars represent 95% CIs. aUpper 95% CI, 117; bUpper 95% CI, 105; cUpper 95% CI, 143; dLower 95% CI, 0, Upper 95% CI, 615; eUpper 95% CI, 103. Abbreviations: CI, confidence interval; DB, double-blind; PBO, placebo; VDZ, vedolizumab.

