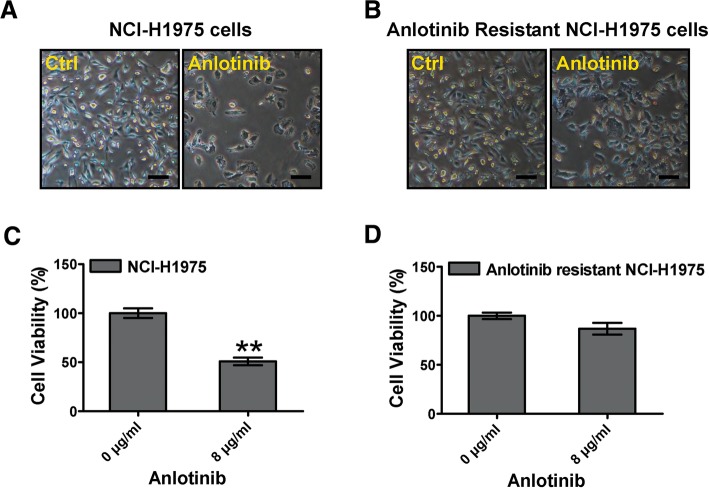
Fig. 1.
Effect of anlotinib on cytotoxicity on NCI-H1975 cells and anlotinib resistant NCI-H1975 cells. a, b NCI-H1975 cells and anlotinib resistant NCI-H1975 cells were treated with anlotinib (8 μg/ml) for 24 h, and then the cell numbers were captured by phase-contrast microscopy. Scale bar, 50 μm. c, d Cell viabilities were examined when NCI-H1975 cells and anlotinib resistant NCI-H1975 cells were exposed to anlotinib (8 μg/ml) for 24 h. Data are shown as the mean ± SD, n = 3, **P < 0.01

