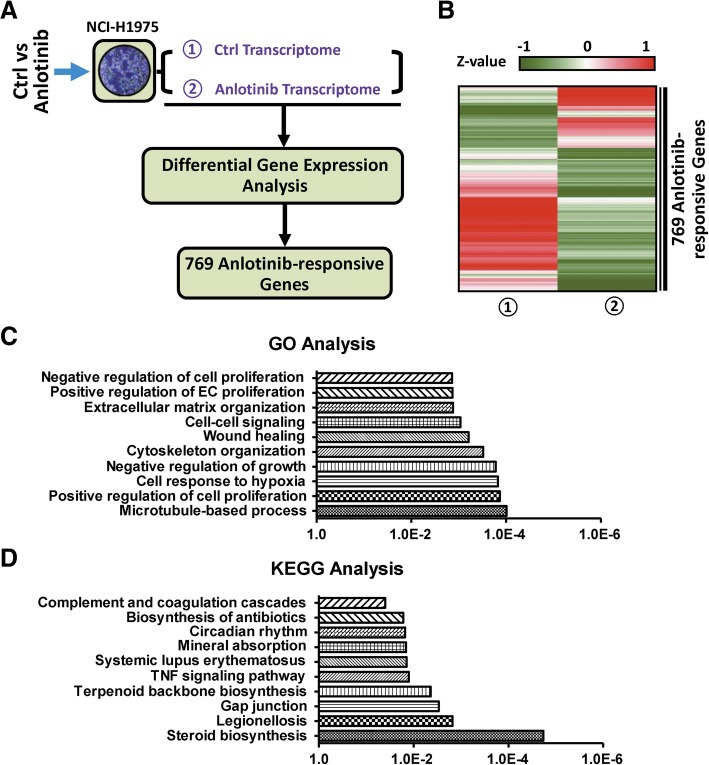
Fig. 2.
Identification of anlotinib-responsive genes in anlotinib-treated NCI-H1975 cells. a Flow diagram of the analysis for screening out 769 anlotinib-responsive genes. b Heat map representation of 769 anlotinib-responsive gene expressions upon NCI-H1975 cells and anlotinib-treated NCI-H1975 cells. c GO analysis of 769 anlotinib-responsive genes. d KEGG pathway analysis of 769 anlotinib-responsive genes

