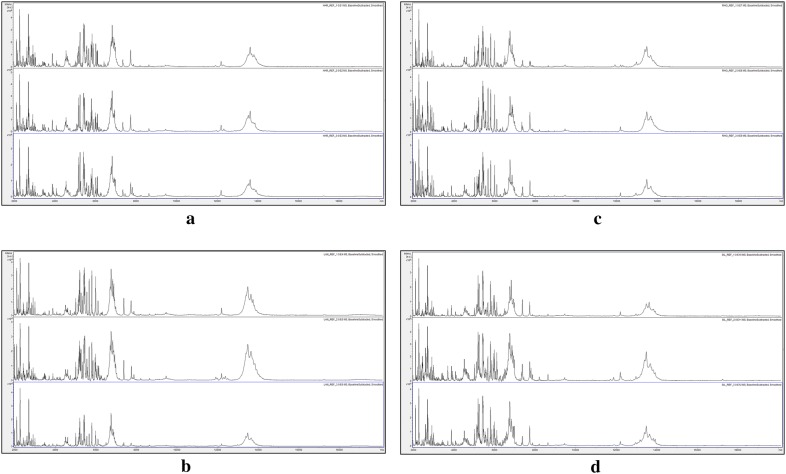
Fig. 3.
Triplicate reference-sample MALDI-TOF MS spectra of acid-soluble seed proteins from randomly-selected seeds collected in 2017 from a Harmondsworth Moor, b Lampeter, c Rhosmaen, and d Silwood Park. The y axes show arbitrary intensity units and the x axes show molecular weight. Spectra are shown baseline-subtracted, smoothed, y-axis-autoscaled, and covering the mass range 2 kDa to 20 kDa (with x-axis scale increments of 2 kDa)

