Fig. 2.

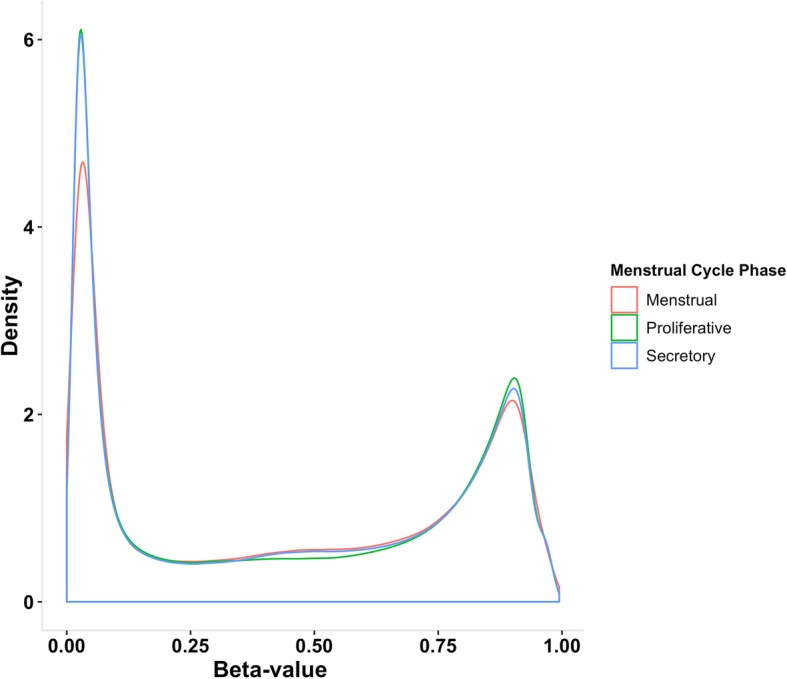
Density plot showing the distribution of beta values measured at each DNA methylation (DNAm) probe in endometrium from three menstrual cycle hases, the menstrual phase, proliferative phase and secretory phase

Density plot showing the distribution of beta values measured at each DNA methylation (DNAm) probe in endometrium from three menstrual cycle hases, the menstrual phase, proliferative phase and secretory phase