
Fig. 2.
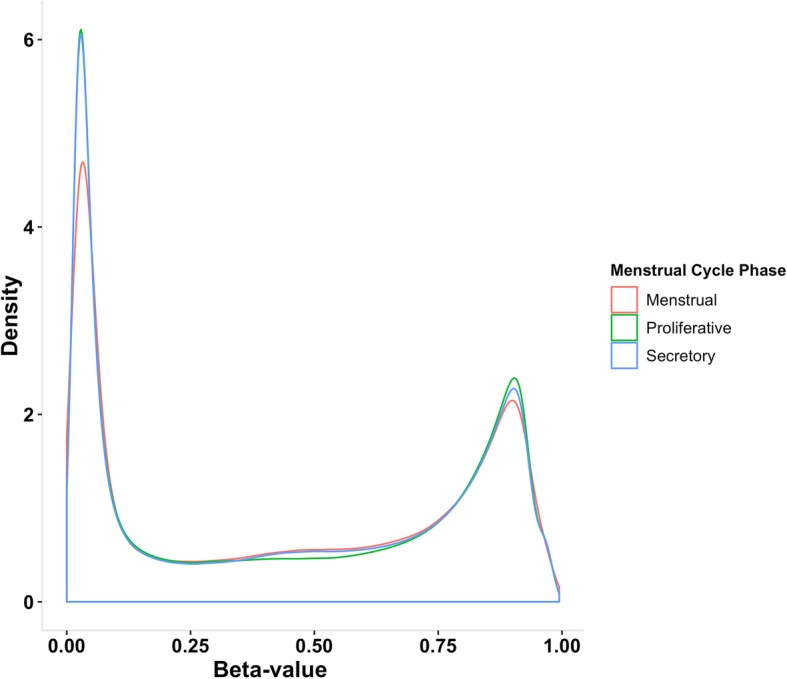
Density plot showing the distribution of beta values measured at each DNA methylation (DNAm) probe in endometrium from three menstrual cycle hases, the menstrual phase, proliferative phase and secretory phase
Official websites use .gov
A
.gov website belongs to an official
government organization in the United States.
Secure .gov websites use HTTPS
A lock (
) or https:// means you've safely
connected to the .gov website. Share sensitive
information only on official, secure websites.
Density plot showing the distribution of beta values measured at each DNA methylation (DNAm) probe in endometrium from three menstrual cycle hases, the menstrual phase, proliferative phase and secretory phase