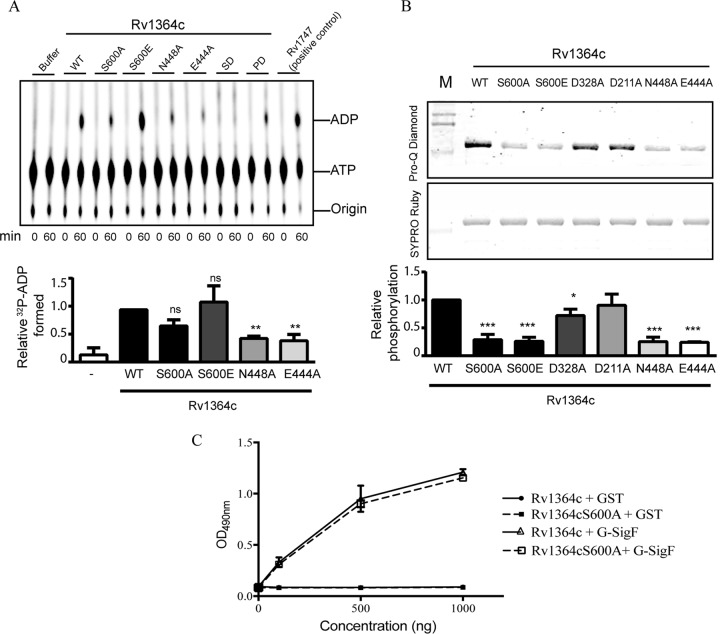
FIG 1.
Conserved ATPase and autophosphorylation activity in Rv1364c and effect on interaction with SigF. (A) (Top) Thin-layer chromatography- and autoradiography-based ATPase activity of purified Rv1364c, its indicated variants, or the positive control, Rv1747 possessing the ATPase domain, at 0 min and 60 min postincubation with [α-32P]ATP. Buffer alone acted as a negative control. SD, substrate domain of Rv1364c; PD, phosphatase domain of Rv1364c. (Bottom) Relative ADP formation, measured using densitometry and expressed as a percentage of the activity of the wild-type protein. The results from three independent experiments are presented here as the mean ± SEM. (B) (Top and middle) Pro-Q Diamond staining of recombinant Rv1364c and its variants. Pro-Q Diamond staining indicates the phosphorylation level, while SYPRO Ruby stains total protein. (Bottom) The ratio of the two densities normalized for each protein variant to the density of the wild-type protein. Data are means from three independent experiments, each performed in triplicate (mean ± SEM). Analysis of variance and Dunnett’s posttest were used to compare all groups to wild-type Rv1364c (***, P < 0.001; **, P < 0.01; *, P < 0.05; ns, not significant). Lanes M, molecular mass markers. (C) His6-tagged Rv1364c and its phosphoablative variant, Rv1364c S600A, were immobilized (500 ng/well) on the surface of the microtiter plate and challenged with increasing concentrations (0 to 1,000 ng) of GST-tagged fusion proteins, SigF, and GST alone (negative control) in solution. The error bars indicate the mean ± SD for triplicate readings.

