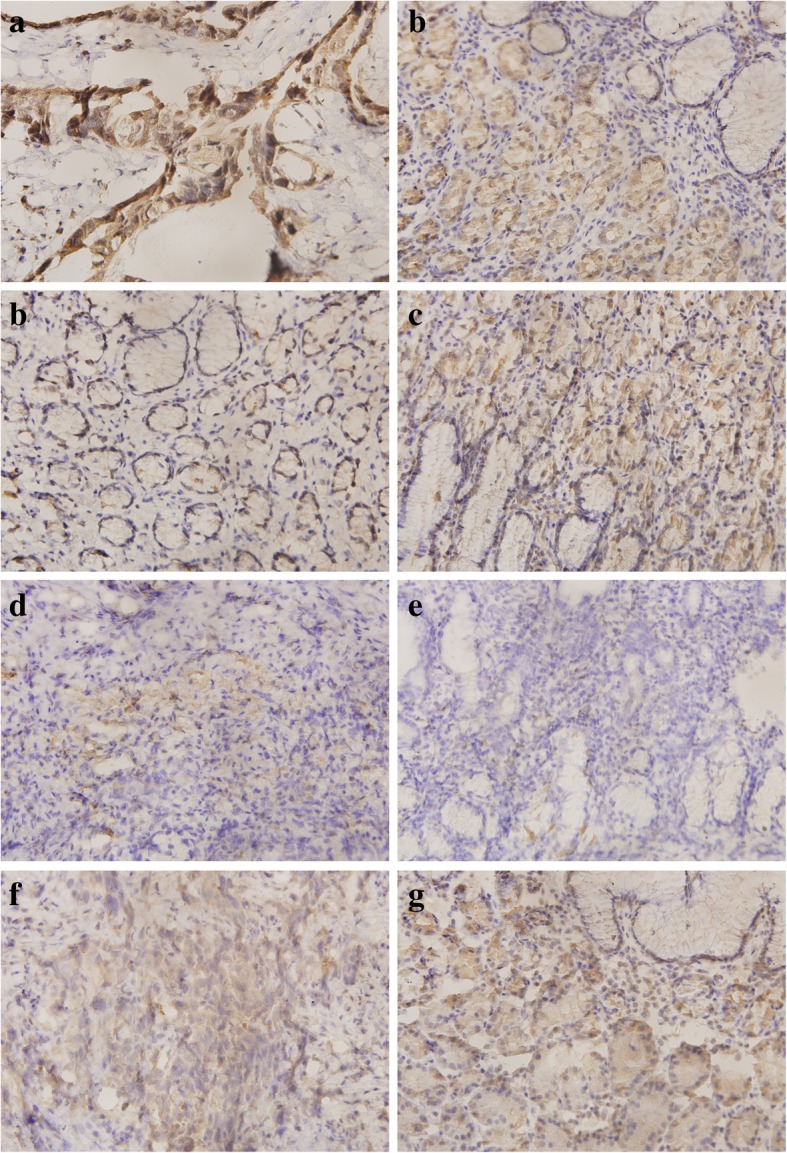
Fig. 3.

Immunohistochemical staining of OLFML2B in gastric specimens. Matched (a) and (b), high expression of OLFML2B in GC and low expression in NG tissues; Matched (c) and (d), low expression of OLFML2B in GC tissues and high expression in NG; Matched (e) and (f), low expression of OLFML2B in GC and NG; Matched (g) and (h), there was no statistical difference between GC and NG tissues. Left: GC tissues (× 400); Right: NG tissues (× 400)
