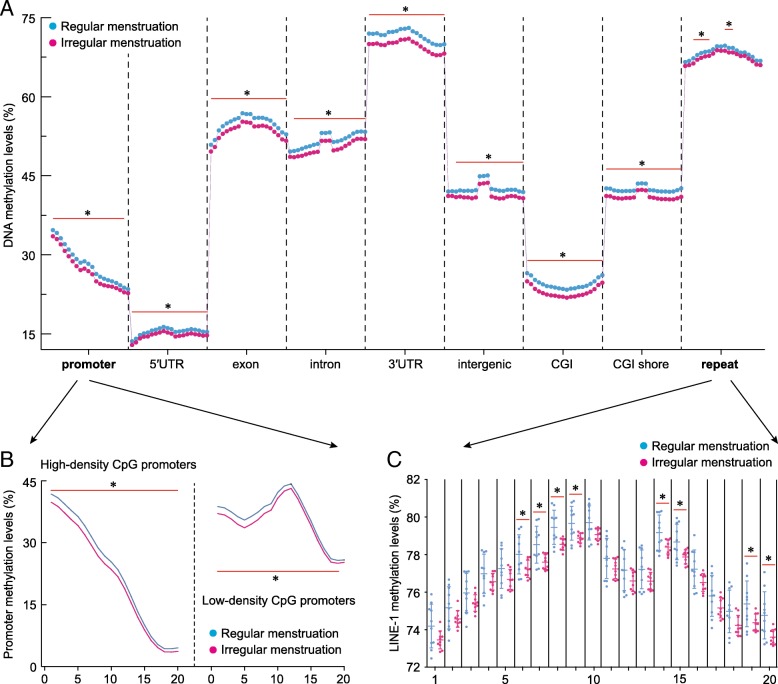
Fig. 1.
DNA methylation dynamics on different annotated genomic elements. a Differences in methylation levels of the promoter, 5′UTR, exon, intron, 3′UTR, intergenic, CGI, CGI shore, and repeat regions in human ovarian tissues from women with regular and irregular menstrual cycles. DNA methylation level was calculated as the average DNA methylation level based on all CpG sites in each region, and each region was further divided into 20 bins (20 dots) to evaluate the methylation levels. b Promoters were further classified as high-density CpG promoters and low-density CpG promoters. c Differences in methylation levels of the long interspersed nuclear element (LINE-1) were further analyzed. Each group, n = 10. *p < 0.05 vs. control group

