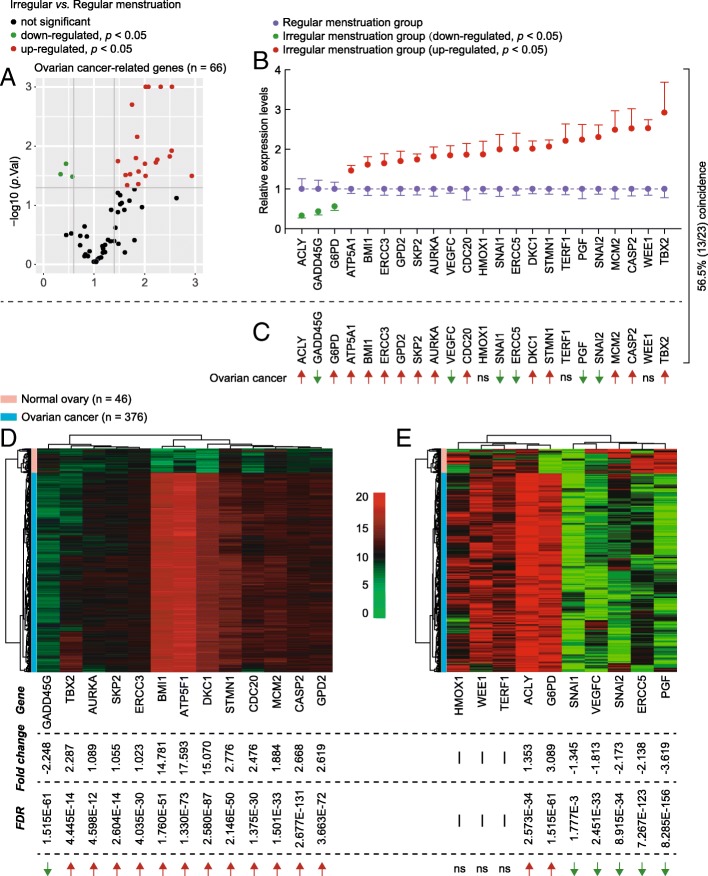
Fig. 3.
Expression levels of cancer-related genes in ovarian tissue from women with regular and irregular menstrual cycles. a Volcano plots depicting the relative expression levels (x-axis) and statistical significance (−log10 p value, y-axis) of cancer-related genes in ovarian tissue from women with regular and irregular menstrual cycles. b Differences in expression patterns of 23 cancer-related genes in ovarian tissue from women with regular and irregular menstrual cycles. Each group, n = 10. c Trends in the 23 differently expressed cancer-related genes in ovarian cancer. d and e. Heat-map showing the expression levels of the differentially expressed genes in ovarian cancer that were coincident (d) or mismatched (e) with the expression trend of the irregular menstruation group. FDR, false discovery rate. Ns, not significant

