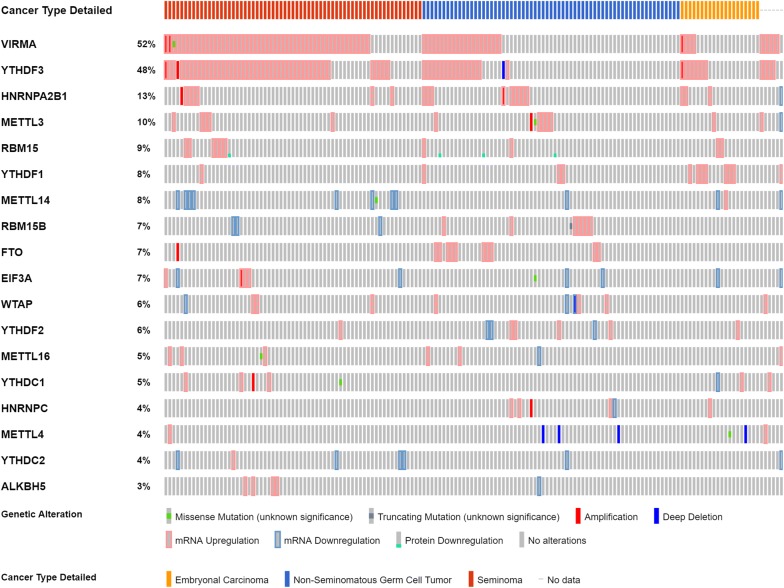
Fig. 1.
In silico analysis: frequency of alterations in queried genes in TCGA database. Notice the frequency of alterations in VIRMA and YTHDF3 compared to other queried genes. Also, note the frequent co-existence of alterations in this pair of genes, and the high proportion of seminomas showing deregulation of such genes

