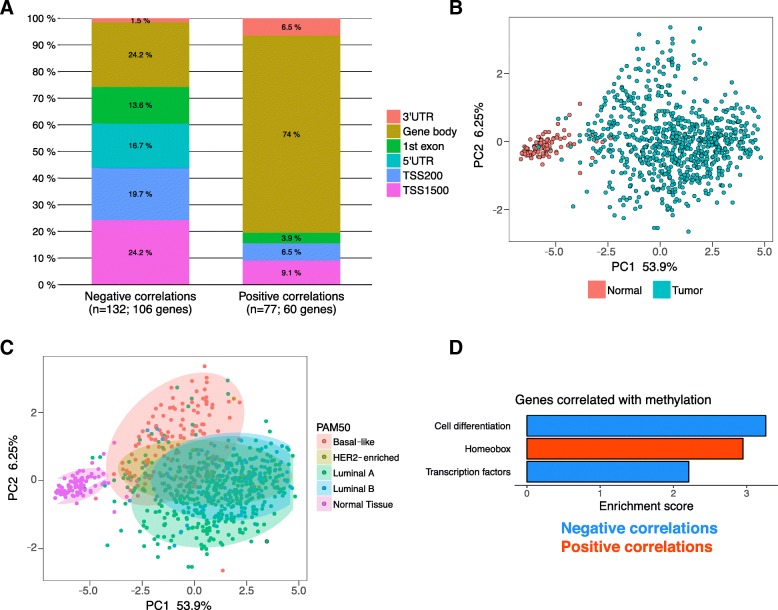
Fig. 2.
209 CpG probes are correlated with cognate gene expression. a Stacked bar plot showing localization of differentially-methylated CpG sites within their cognate genes subdivided by the correlation between methylation change and expression change. Negatively-correlated CpG sites are shown in the first bar, and positively-correlated CpG sites in the second bar. The distributions are significantly different (P < 2.2 × 10− 16, Pearson’s chi-squared test). b and c Principal Component Analyses using the 209 differentially-methylated probes located in differentially-expressed genes, colored by (B) sample type or (C) PAM50 subtype. d Enriched Gene Ontology categories using DAVID clustering enrichment scores for genes with negative (blue) or positive (red) correlations

