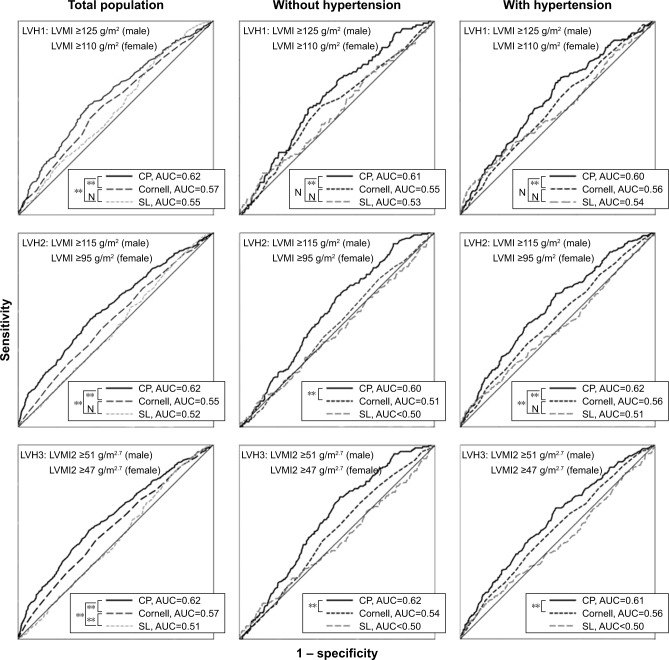
Figure 1.
ROC curve with three electrocardiographic criteria for detecting LVH1, LVH2, and LVH3, the ROC curve for defining LVH1 using LVM indexed for BSA (LVMI) ≥125 g/m2 in males and ≥110 g/m2 in females; the ROC curve for defining LVH2 using LVM indexed for BSA (LVMI) ≥115 g/m2 in males and ≥95 g/m2 in females; the ROC curve for defining LVH3 using LVM indexed for BSA (LVMI2) ≥51 g/m2.7 in males and ≥47 g/m2.7 in females. N indicates P>0.05 and **indicates P<0.01.
Abbreviations: AUC, area under curve; BSA, body surface area; CP, Cornell Product; LVH, left ventricular hypertrophy; LVM, left ventricular mass; ROC, receiver operating characteristic; SL, Sokolow-Lyon.

