Fig. 1.
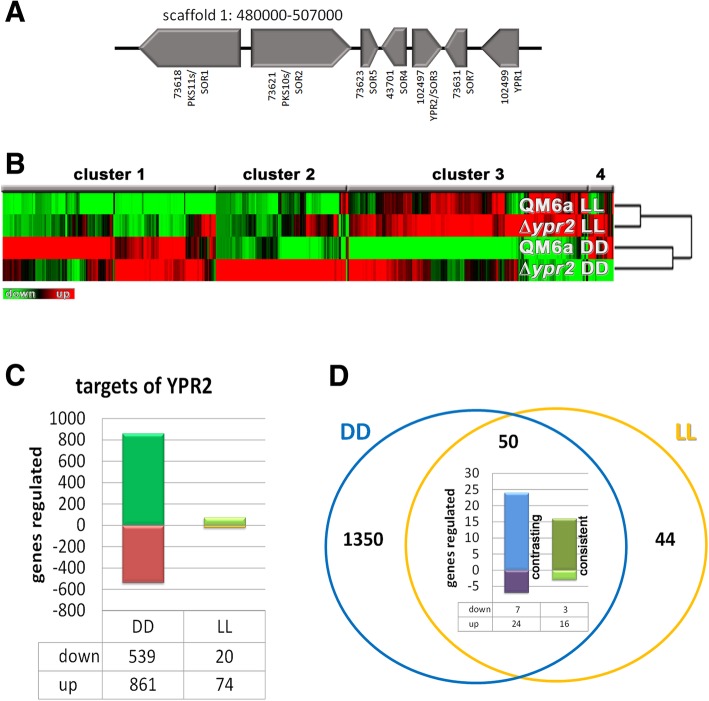
Gene regulation by YPR2 in T. reesei. a Schematic representation of the SOR cluster. Genomic locations are taken from the JGI Trichoderma reesei database v2.0 (https://genome.jgi.doe.gov/Trire2/Trire2.home.html). b Hierarchical clustering of gene regulation patterns in ∆ypr2 compared to wildtype in constant light (LL) and constant darkness (DD) upon growth on cellulose. c Numbers of genes regulated in ∆ypr2 in constant light or constant darkness on cellulose (≥2fold, p-value threshold 0.01). d Genes directly or indirectly regulated by YPR2 in constant light overlapping with gene regulation by YPR2 in constant darkness. The diagram shows the proportion of consistent regulation (upregulation in ∆ypr2 in light and darkness, downregulation in light and darkness) or contrasting regulation (upregulation in light and downregulation in darkness (“up”) or downregulation in light and upregulation in darkness (“down”))

