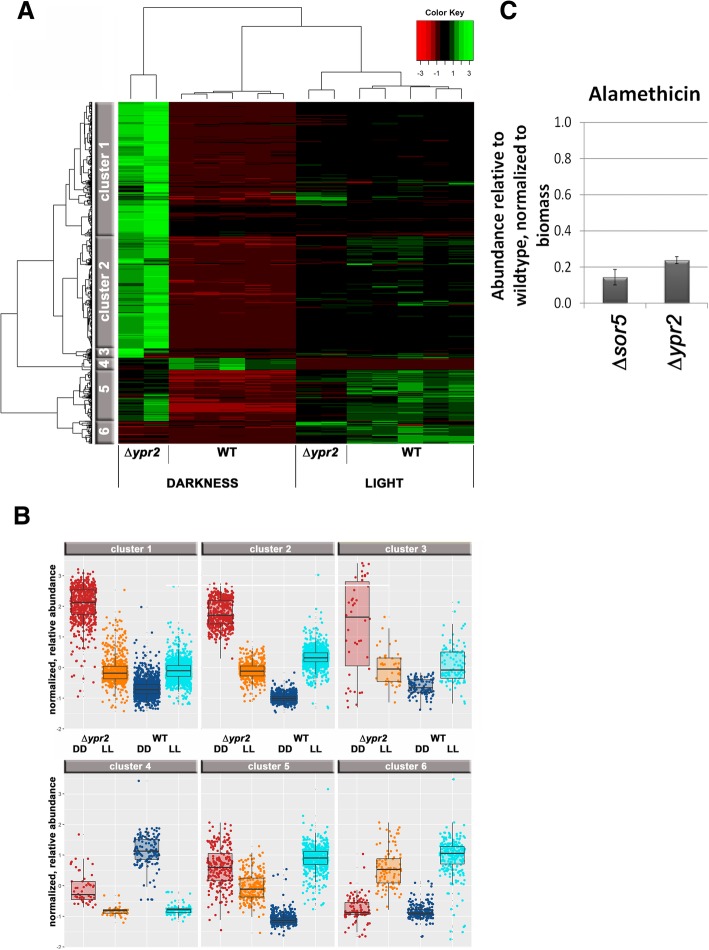
Fig. 4.
Secondary metabolite production in ∆ypr2 upon growth on cellulose. a Results from mass spectrometric analysis revealed 6 clusters of regulation patterns. b Box plots show levels within the clusters as normalized to biomass formation. Mostly, biosynthesis level even decrease below wildtype in the dark. For smaller sets (cluster 5) elevated levels were observed in the mutant compared to wildtype. c Abundance of Alamethicine in samples lacking sor5 (TR_73623) and ypr2 (TR_102497) upon growth on minimal media with cellulose as carbon source, relative to QM6a and normalized to the biomass produced under these conditions. Errorbars indicate standard deviations of at least two biological replicates

