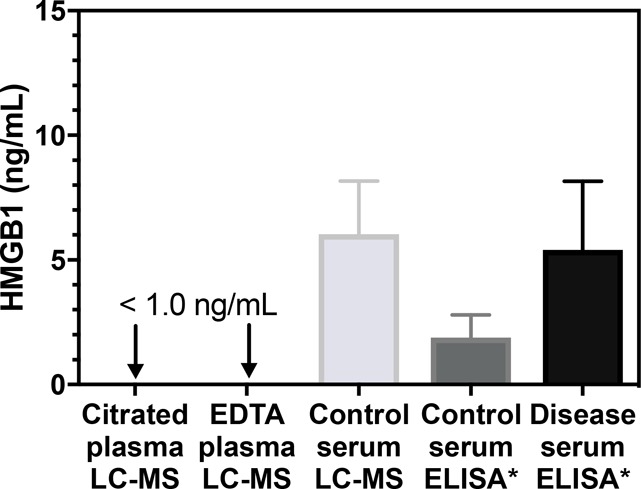
Figure 5.

HMGB1 levels in citrated plasma (<1.0 ng/mL, n = 24), EDTA-treated plasma (<1.0 ng/mL, n = 24), and serum (mean = 6.0 ± 2.1 ng/mL, n = 24) from healthy control subjects, determined by stable isotope dilution IP 2D-nano-UHPLC-PRM/MS, and reported levels of serum HMGB1 determined by ELISA in healthy control subjects (mean = 2.1 ± 0.9 ng/mL) and cases (mean = 5.4 ± 2.8 ng/mL) for 18 of the studies shown in Table 1 (indicated with asterisks). Control plasma and serum samples from healthy subjects for the LC/MS analyses were obtained from the same individuals. Data are shown as means ± stndard deviation (SD).
