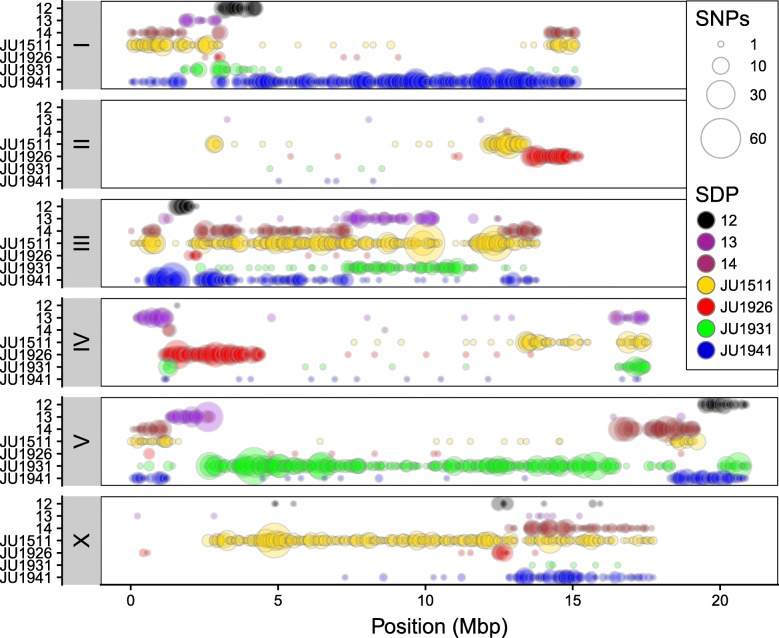
Fig. 2.
Genome-wide SNP distribution in the four parental genotypes. Circle size shows the number of SNPs within 50 kb bin. Colors indicate SNP distribution patterns (SDP) as shown in the legend. These are SDP 12—difference between pair JU1511/JU1926 and pair JU1931/JU1941; SDP 13—difference between pair JU1511/JU1931 and pair JU1926/JU1941; and SDP 14—difference between pair JU1511/JU1941 and pair JU1926/JU1931

