Fig. 3.
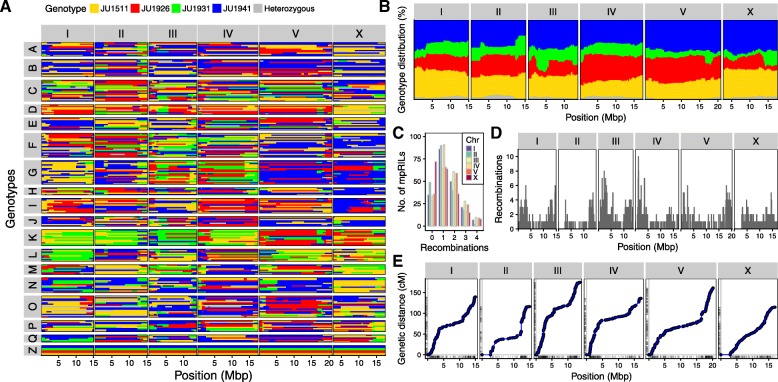
Parental background of the multi parental recombinant inbred lines and recombination and allelic distribution per chromosome. a Colors indicate the parental background per genetic segment (x-axis) per RIL (y-axis) as estimated from the SNP distribution patterns. Chromosomes are in separate panels on the x-axis. mpRILs are grouped according to their cross history. The parental lines are shown in group Z. b Genome-wide distribution of parental alleles. Colors indicate the percentage of parental occurrence (y-axis) per genetic segment (x-axis) as estimated from the SNP distribution patterns. Chromosomes are in separate panels on the x-axis. c Recombination per chromosome. Chromosomes show on the x-axis. Numbers of recombinations per RIL are shown on the y-axis. d Recombination frequency per chromosome. e Genomic distance (x) vs genetic distance (y), the rug lines (small lines on the axis) indicate the marker positions

