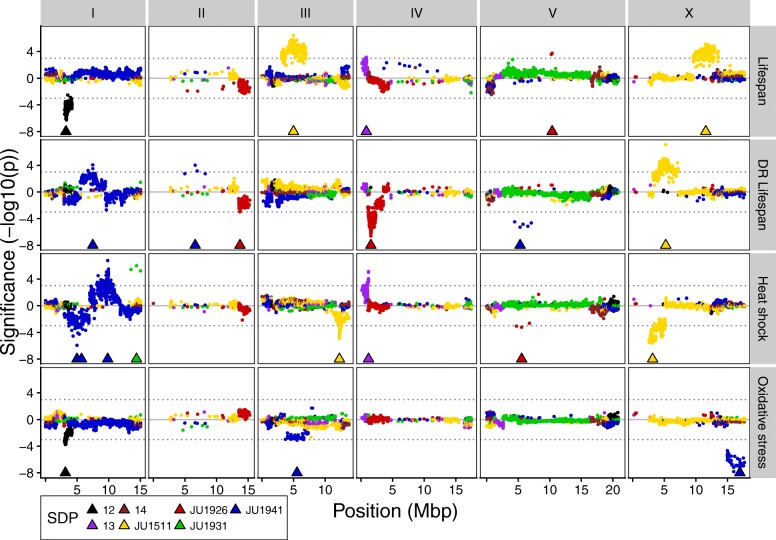
Fig. 6.
QTL profiles of the lifespan and stress phenotypes. Genomic position on the x-axis against the significance on the y-axis. Triangles show the position of the co-factors used in the final mapping model. Significance was multiplied by the sign of the allelic effect to show the effect direction. Colors show SNP distribution patterns (SDP). These are SDP 12—difference between pair JU1511/JU1926 and pair JU1931/JU1941; SDP 13—difference between pair JU1511/JU1931 and pair JU1926/JU1941; and SDP 14—difference between pair JU1511/JU1941 and pair JU1926/JU1931

