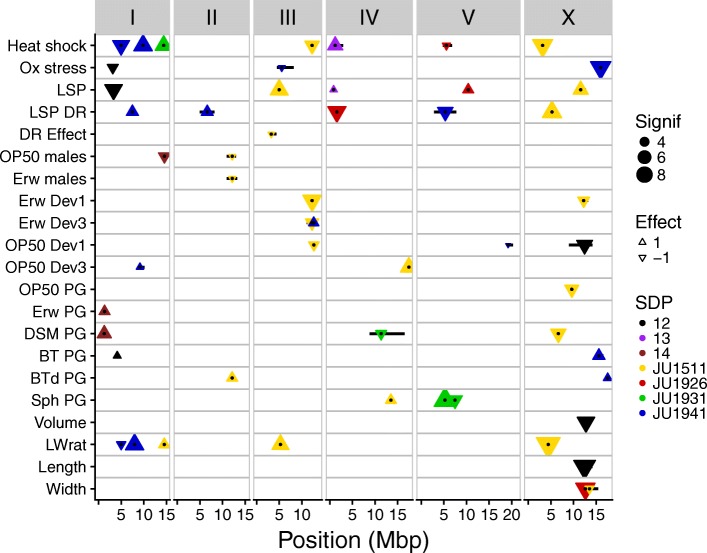
Fig. 7.
Genome-wide overview of QTLs. QTLs are shown by the triangles; triangles pointing upwards show a positive allelic effect, and triangles pointing downwards show a negative allelic effect. Size indicates significance in −log10(p); colors show SNP distribution patterns (SDP). These are SDP 12—difference between pair JU1511/JU1926 and pair JU1931/JU1941; SDP 13—difference between pair JU1511/JU1931 and pair JU1926/JU1941; and SDP 14—difference between pair JU1511/JU1941 and pair JU1926/JU1931. Black dots show the exact location of the peaks and the black horizontal bars the 2 −log10(p) drop QTL intervals

