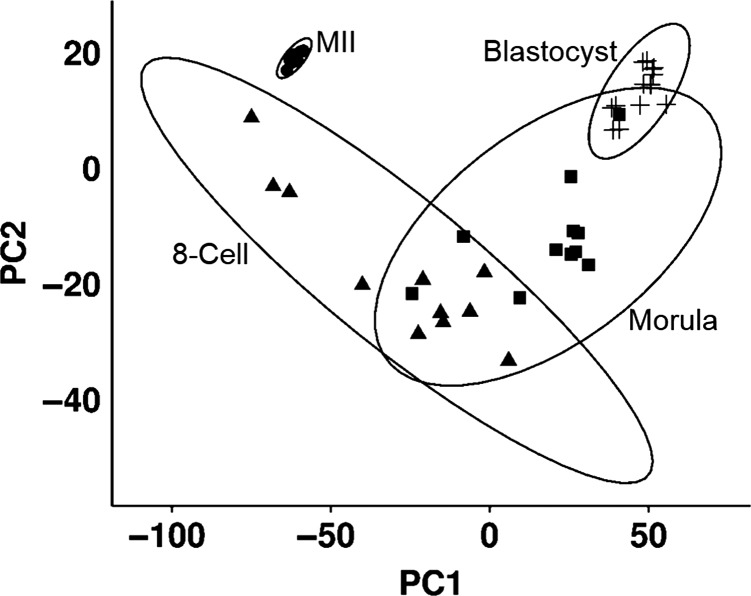
Figure 1.
Principle component analyses shows the relationships between the 43 samples of the metaphase II oocytes (MII), 8-cell embryos (8-cell), morula and blastocyst (Blast). Ellipses surrounding each embryo stage cluster are based on 95% confidence intervals. The MII and blastocyst samples show a tight grouping indicating high levels of homogeneity of expression while the 8-cell and morula samples have greater heterogeneity resulting in an increased spread.

