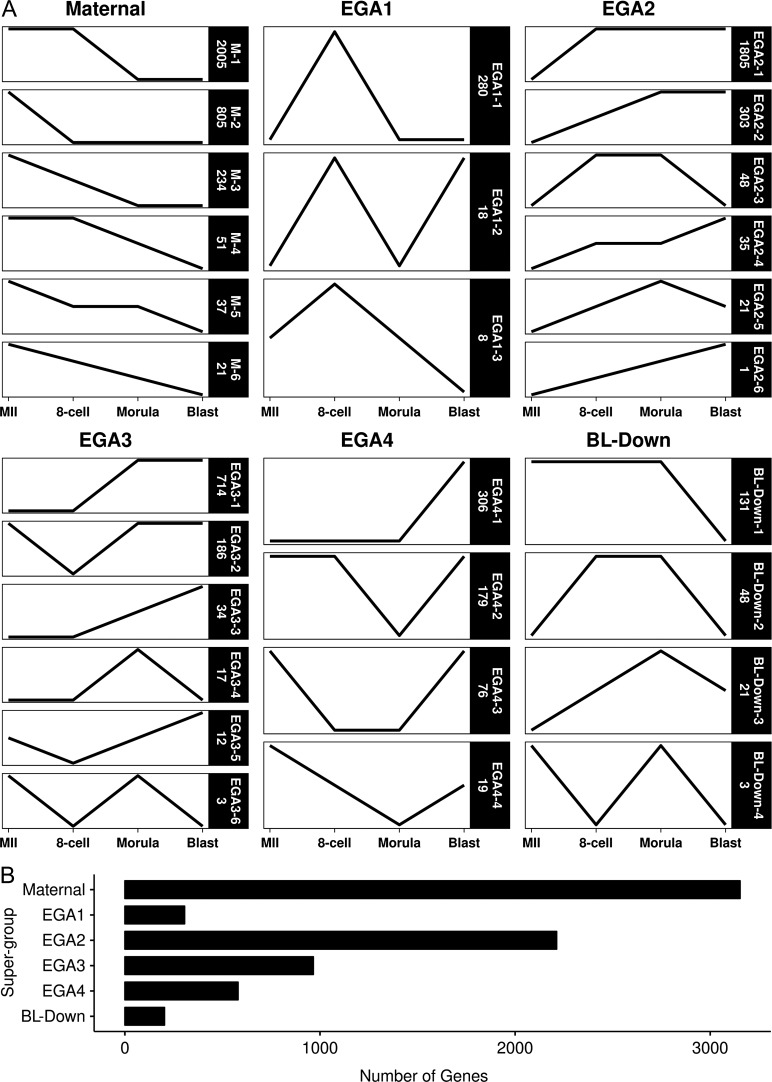
Figure 2.
Classification and quantification of the 7349 DEGs into 26 trend-line groups, categorized within each super-group. Trend-line groups were defined by mRNAs showing the same patterned in changes of expression. An increase or decrease in the slope of a line indicates a significant change in expression, while a horizontal line represents a significant change. Panel A has the individual trend-lines for each trend-line groups, collated by their respective super-group. Maternal trend-lines have maximal expression at MII with no subsequent increase, limited to decreases or no changes. EGA1 through EGA4 trend-lines are defined by their shared first significant increases at 8-cell, morula and blastocyst stages, respectively. BL-Down are trend-lines with a decrease at the blastocyst stage. Each trend-line group in Panel A is labeled on the right with its designation (e.g. EGA1-1) and number of mRNAs in the group (e.g. 280). Summation of all genes classified by super-group are plotted in Panel B. Note that BL-Down groups 2, 3 and 4 are the same as EGA2-3, EGA2-5 and EGA3-6.

