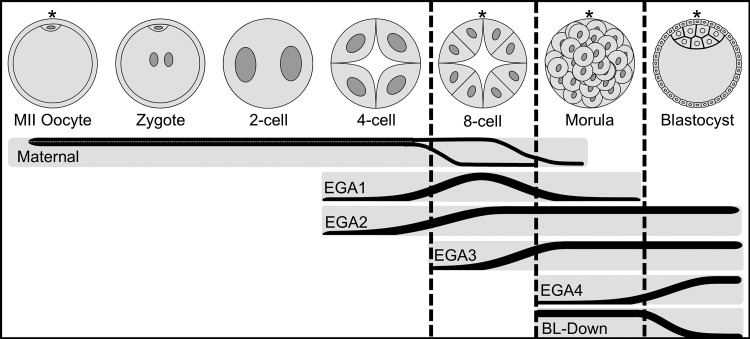
Figure 3.
Depiction of the major stages of preimplantation development and the corresponding relationship of the super-groups. Stages with sequenced data are denoted with an asterisk and bounded by vertical dashed lines representing transitions between the represented samples. The six super-groups are plotted in relation to development stage, increase or decrease in slope indicates change in mRNA abundances during a transition. Maternal = mRNAs of maternal origin with decrease in mRNA abundance, EGA1 through EGA4 = embryonic genome activation, BL-Down = mRNAs with decreasing expression at blastocyst.

