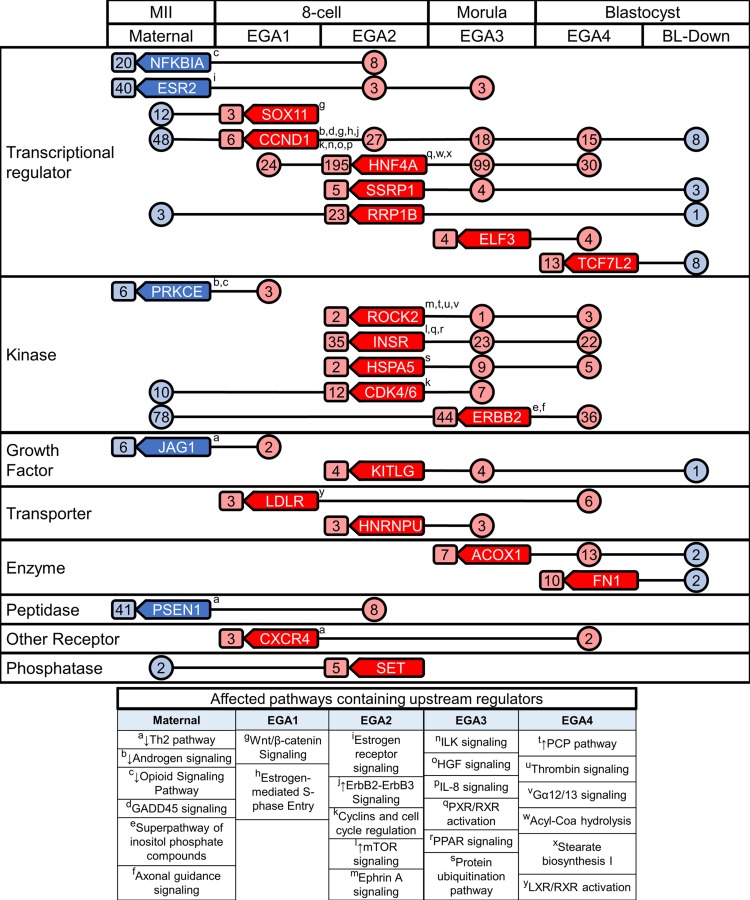
Figure 8.
Diagram of the key 24 upstream regulators (URs) across the preimplantation period. Upstream regulators are shown in rounded boxes with a left facing point in their super-group origin. The numbers of downstream effectors regulated by each UR are shown within circles or rounded boxes. Boxed numbers adjacent to URs denote regulation within the stage of origin, and circled numbers connected by lines indicate transient regulation. Superscripts (a–y) denote that the UR was a member of a canonical pathway. Red coloring indicates an upregulation of URs and downstream targets, while blue indicates downregulation. These 24 URs target/interact with 1053 of the differentially expressed genes during development.

