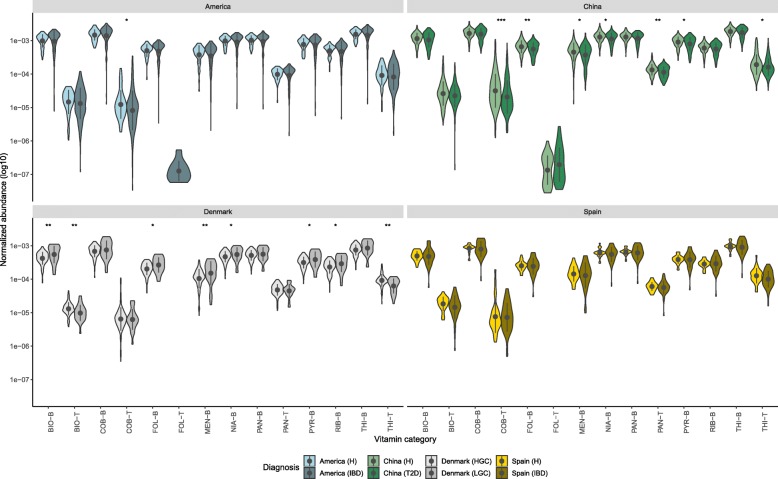
Fig. 2.
Violin plot showing total normalized abundance of genes in fecal samples from four different countries (i.e. USA, China, Denmark, Spain) under different states of health and disease. Microbial genes annotated to KOs were grouped into the respective type of B and K2 vitamins. The pointrange refers to the mean and standard deviation. The shape represents the kernel probability density of the data across different vitamin types are abbreviated as: biotin (BIO), cobalamin (COB), folate (FOL), menaquinone (MEN), niacin (NIA), pantothenate (PAN), pyridoxine (PYR), riboflavin (RIB), thiamine (THI). Suffixes that end with -B and -T are related to biosynthetic and transporter related genes respectively. The asterisks on the top indicate ns: p > 0.05, *: p < = 0.05, **: p < = 0.01, ***: p < = 0.001, ****: p < = 0.0001 (Mann-Whitney Wilcoxon test)

