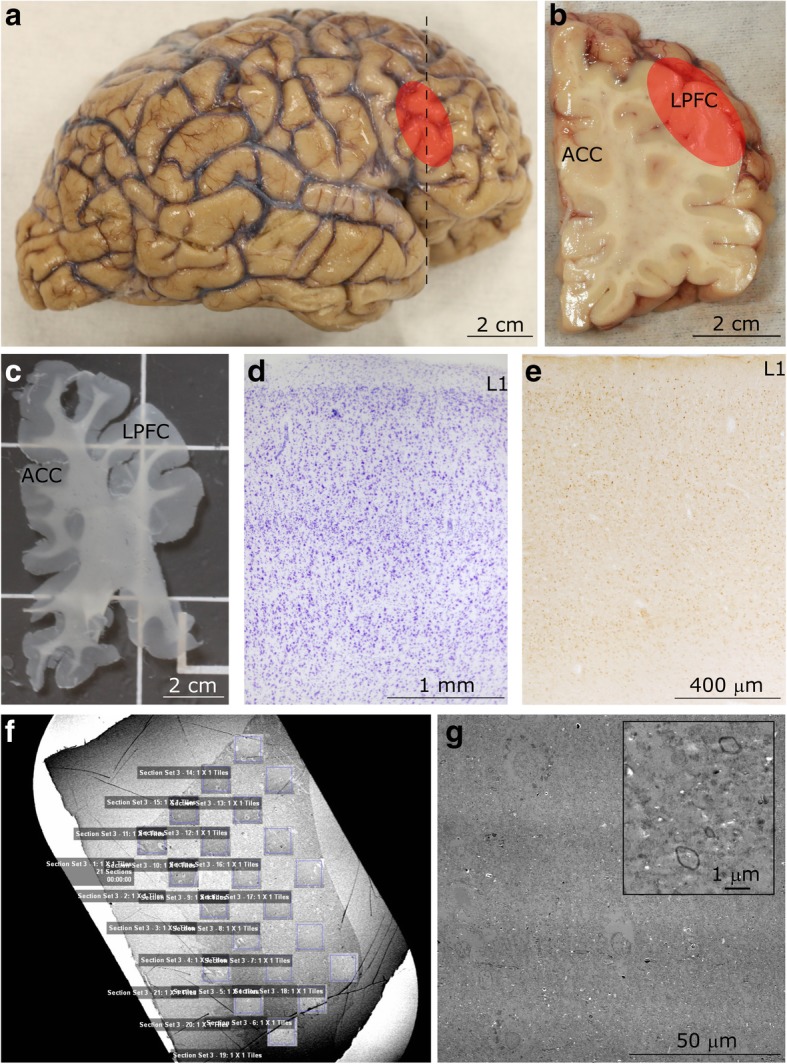
Fig. 1.

Experimental design. a Lateral view of the right hemisphere of the adult human brain. The region of the lateral prefrontal cortex (LPFC) analyzed in this study is shown in red. b Coronal tissue slab taken from the frontal cortex at the level marked by the dotted line in a. The red overlay highlights the LPFC at the level of Brodmann’s area 46. c Representative free-floating tissue section, cut at 50 μm, used for staining. d-e Representative cortical columnar regions of interest processed for Nissl d and calretinin e in the LPFC. Layer 1 (L1) is labeled in both columns. f Representative image of a 50 nm-thick section from LPFC gray matter on a pioloform-coated slot grid to show the unbiased systematic sampling scheme used to analyze axons at the EM level. This scheme also resembles the sampling used in quantitative analysis of cell and axon populations at the light microscope. g Representative high-resolution electron micrograph of an ultrathin section (50 nm), sampled from f, and acquired using a scanning-transmission electron microscope (STEM) system. Myelinated axon profiles can be identified by the darkly stained, electron dense ring of myelin surrounding the axolemma (shown at high magnification in inset). This representative image was taken from layer 5 of LPFC
