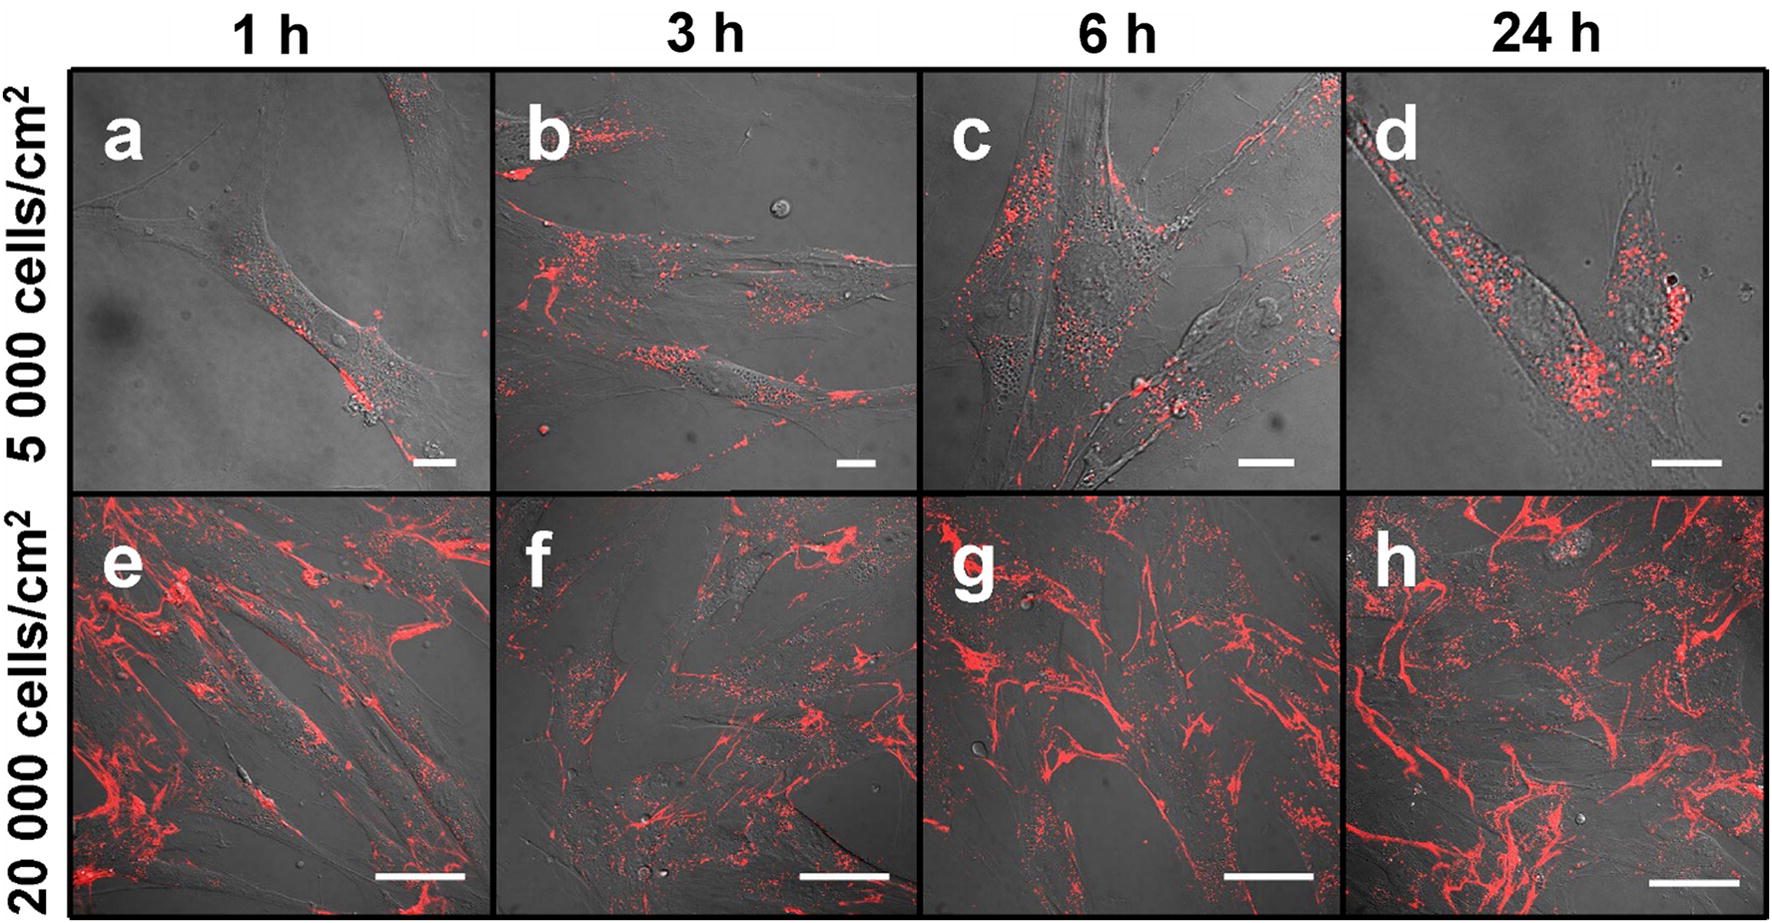
Fig. 3.

Confocal fluorescence microscopy images showing carboxylated quantum dots localization in MSC culture at different cell cultivation densities. At low cultivation density (5000 cells/cm2; top row), QDs (red) distribute intracellularly and at high cultivation density (20,000 cells/cm2; bottom row), QDs deposit on long cytoplasmic processes attaching cells 1 h (a, e), 3 h (b, f), 6 h (c, g) and 24 h (d, h), respectively, after QDs introduction. Scale bars 15 μm (a–d) and 50 μm (e–h)
