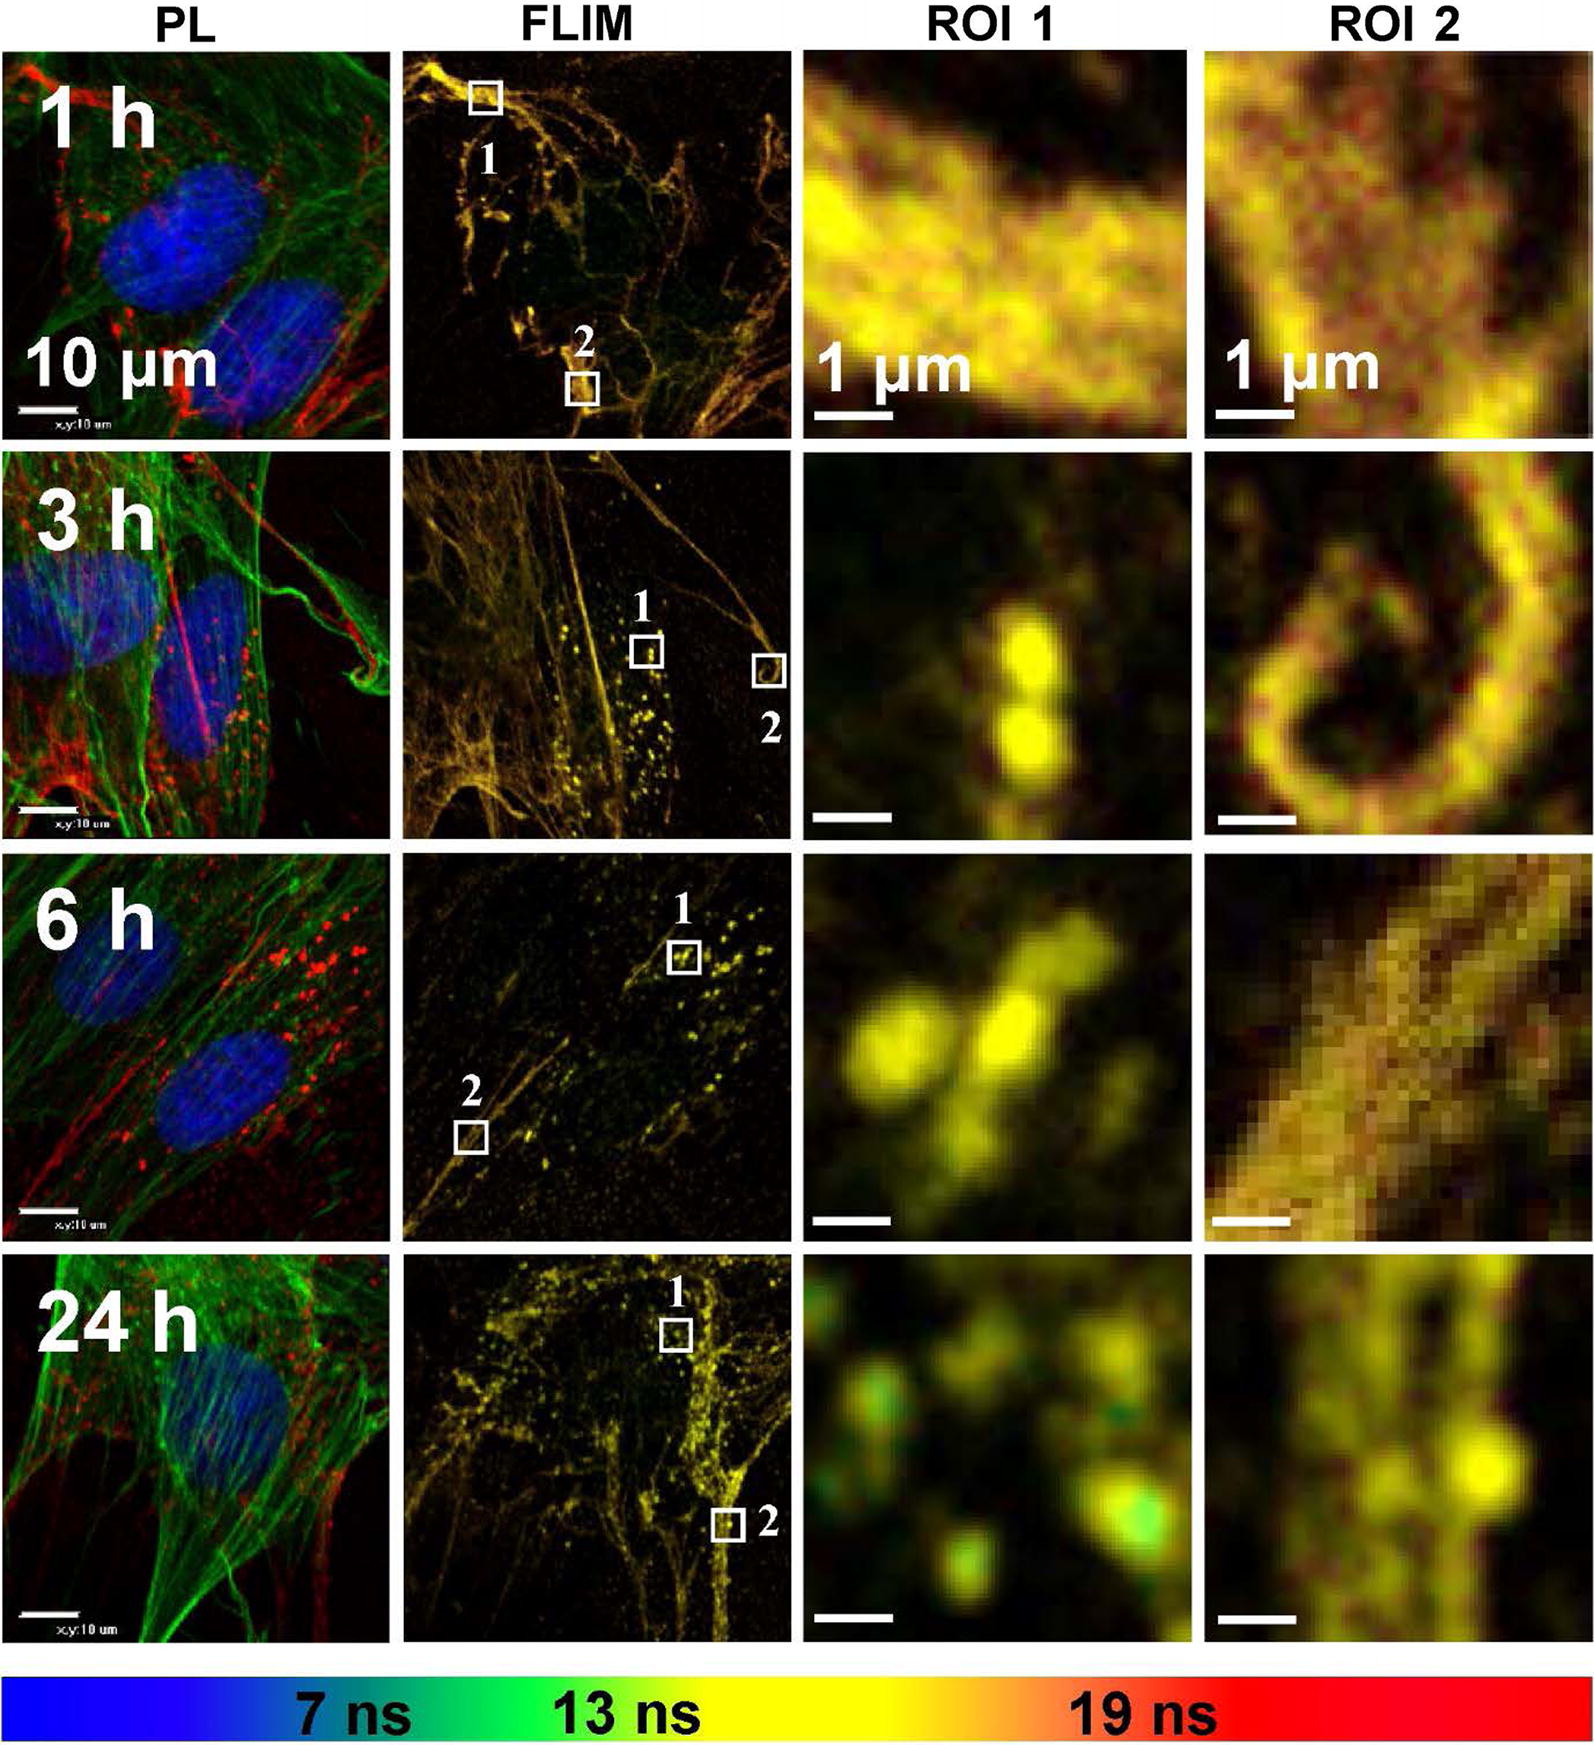
Fig. 6.

Confocal photoluminescence images of MSCs at different times of incubation with carboxylated QDs showing intracellular distribution. FLIM images of MSCs with marked regions of interest (ROI) which are enlarged in columns ROI 1 and ROI 2. Scale bars for PL and FLIM images 10 µm and 1 µm for enlarged ROI. FLIM images are overlaid and in different lifetime decay gates (< 7 ns—blue, 7–13 ns green, 13–19 ns yellow and 19–29 ns—red)
