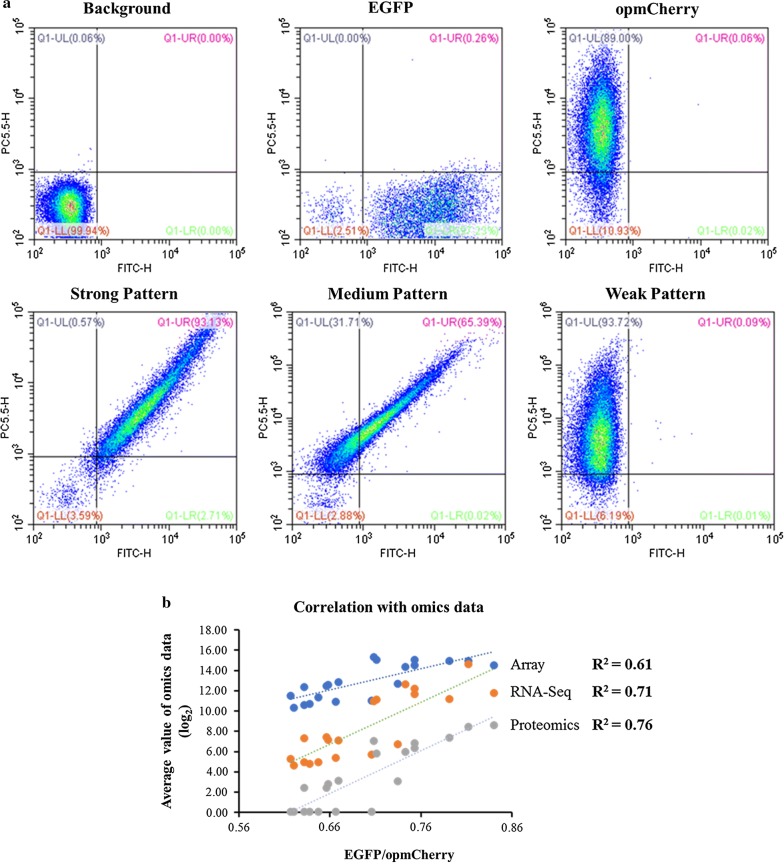
Fig. 4.
Flow cytometry (FCM) patterns of different promoters, in which the X- and Y-axis represents the fluorescent signal of EGFP and opmCherry, respectively. The background represents the fluorescence of the strain harboring an empty vector pEZ15Asp; EGFP and opmCherry represent the fluorescence of the strain harboring PlacUV5 driving single reporter gene, EGFP and opmCherry, respectively. The strong, medium and weak pattern is the pattern of representative promoters of ZMO0177, ZMO1351, and ZMO0300, respectively (a); and the correlation of experimental data of EGFP/opmCherry ratios in log phase with log2-based values of omics data of array, RNA-Seq and proteomics, respectively (b)

