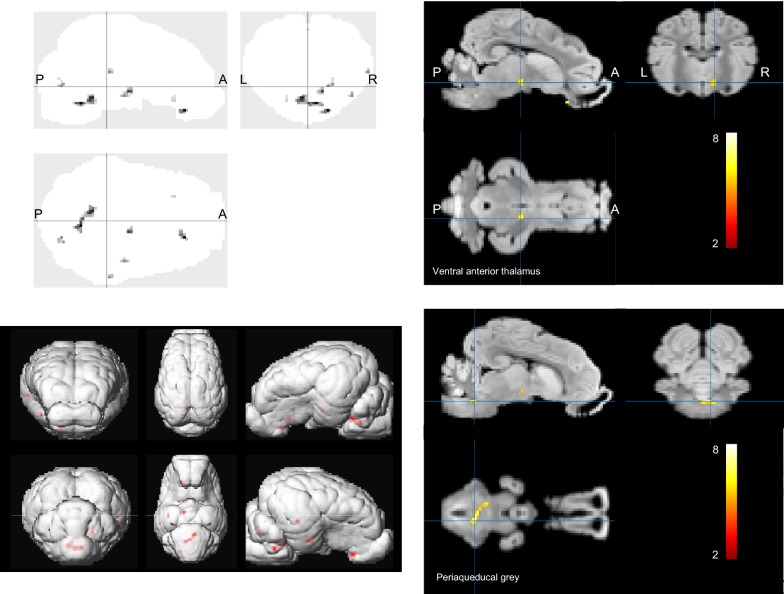
Fig. 2.
Statistical parameter mapping of 18FDG uptake (CMRglu) in sham and stimulated group. SPM analysis was performed using pixel-wise modeled quantitative PET images. Statistical differences were analyzed using T-test in SPM12, P < 0.001 FDR and cluster level corrected. The analysis was performed with a cluster size of 100 voxels each of the cluster representing 1 mm3. Note the activation in the thalamic and periaqueducal grey areas. Top left—brain glass with activation in shade of grey. Top right—thresholded activation (in color scale) depicting the ventral anterior thalamic activation. Bottom left—3D representation of the activation matrix. Shade of red indicates activation. Bottom right—thresholded activation (in color scale) with the image centered on the periaqueducal grey

