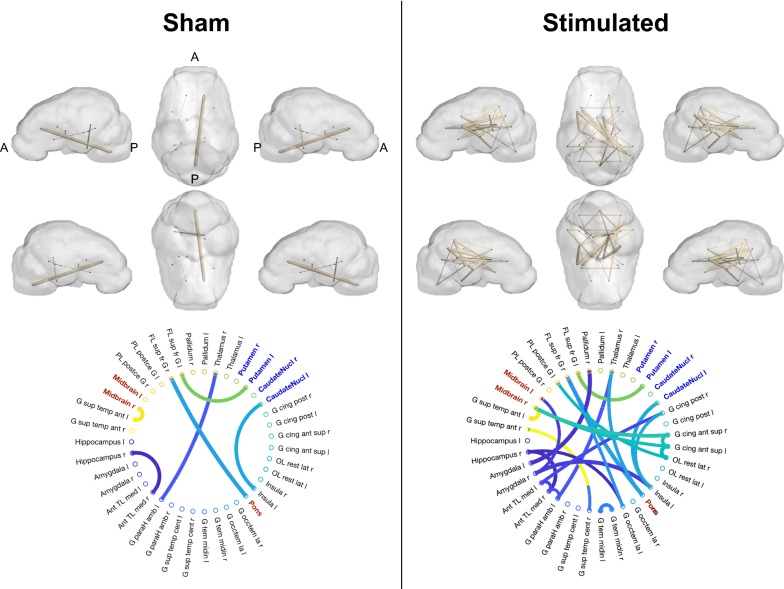
Fig. 3.
Metabolic connectivity analysis in the sham and stimulated groups. A. The figures showed the results of connectivity analysis performed with NetPET software using CMRglu coded voxel-vised images. Top panels—surface renderings of the brain overlaid with network connections. Nodes and edges were coded using BrainNet viewer and edges were thresholded for P < 0.001. Only nodes with attached edges were represented. Bottom panels—Correlograms representing the correlation weighted matrices thresholded at P < 0.001. Nodes’ abbreviations are expended in the Additional file 1: Table S1. Note the increased metabolic connectivity in stimulated compared to sham group

