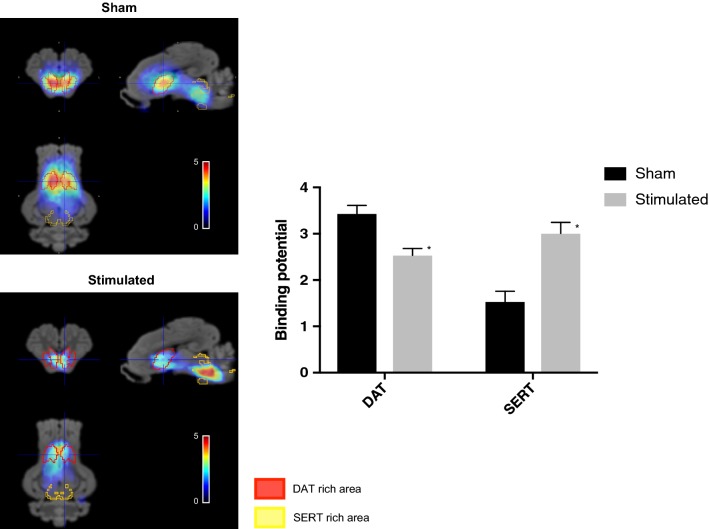
Fig. 4.
Left panels—examples of reconstructed normalized volumes obtained after the administration of 123I ioflupane in sham versus stimulated animals. The colors represented pixel-wise modeled SPECT dynamic image series according to Ichise i.e., the binding potential overlaid on the MRI template of the pig brain atlas. Red VOIs corresponded to DAT-rich areas whereas yellow VOIs represented SERT-rich areas. Right panel—binding potential for DAT and SERT in sham versus stimulated groups obtained from region-based analysis. *Indicates a significant difference at P < 0.001

