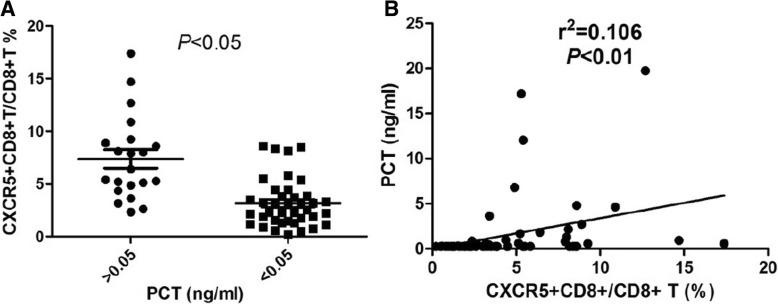
Fig. 3.
Elevation of PCT was positively correlated with increased CXCR5 + CD8+ T cells. a, Levels of circulating CXCR5 + CD8 + T cells between patients with PCT > 0.05 and PCT < 0.05 ng/ml. b, Scatterplot of CXCR5 + CD8+ T cell vs PCT. Each point in the scatter plot represents the value of two variables for a given observation. The rank Spearman correlation coefficient confirms that ratio of CXCR5 + CD8+ T cells and PCT are correlated

