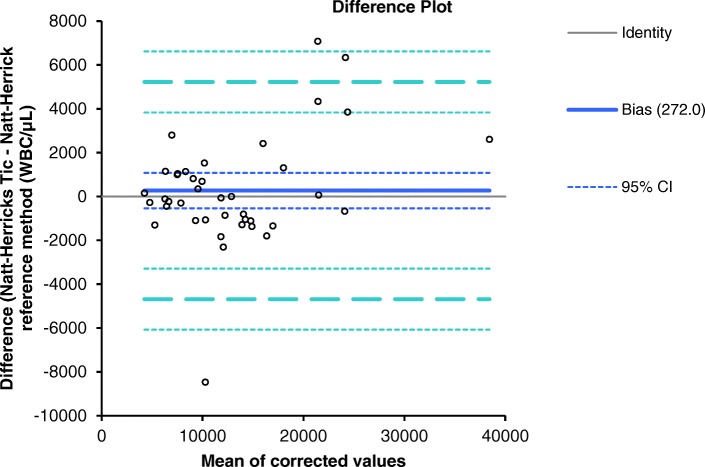
Fig. 2.
Bland-Altman difference plot for avian white blood cell count (absolute WBC/μL). The thin horizontal line (0 at the y-axis) is the line of identity; the thick blue line indicates the bias (the mean difference between the methods), with their confidence intervals as thin dashed lines. The thick dashed horizontal lines are the 95% limits of agreement with their 95% confidence intervals

