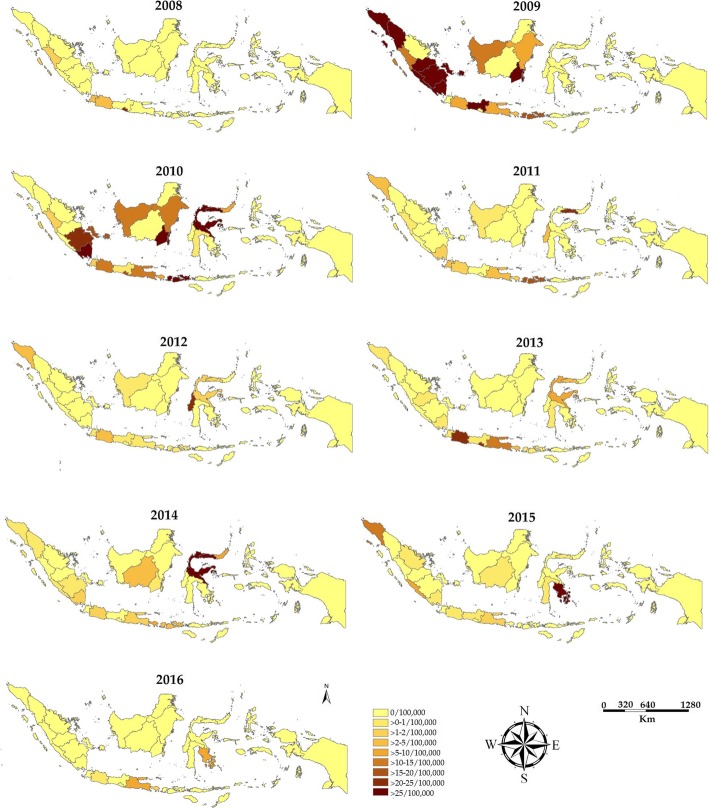
Fig. 3.
Geographical mapping of incidence rates of Chikungunya virus infection in Indonesian provinces from 2008 to 2016 (per 100,000 persons). Annual number of chikungunya cases from each Indonesian province was extracted from the Ministry of Health of the Republic Indonesia and the map was created using ArcGIS. The colour gradation indicates the incidence rates

