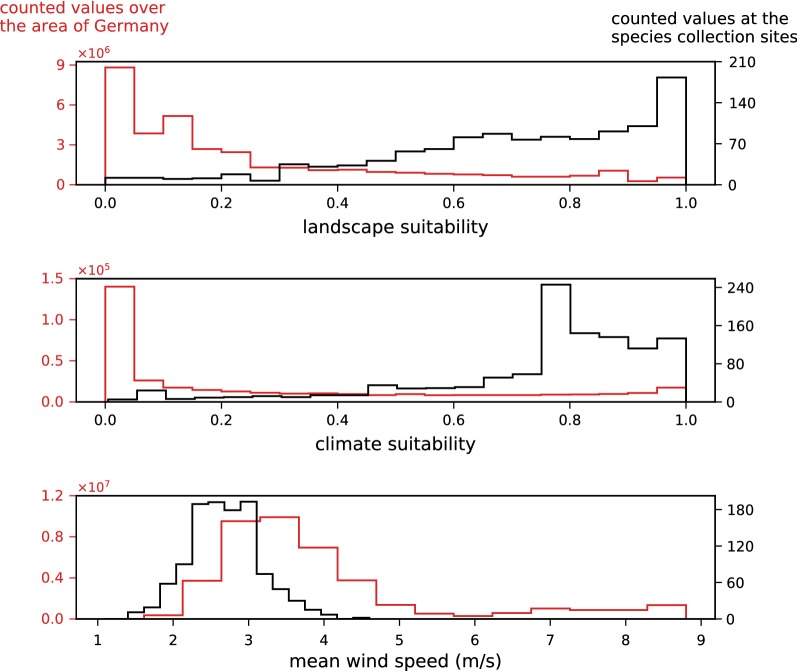
Fig. 8.
Analyses that helped define the fuzzy membership functions. Histograms showing for each input raster array (landscape suitability, climate suitability and mean wind speed) the distribution of values at the field collection sites (black line) compared to the distribution of values of the input raster arrays (red line)

