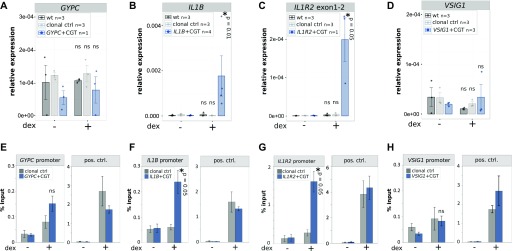
Figure 2. Genomic insertion of a single GBS results in gene-specific acquired GR binding and GR-dependent transcriptional regulation.
(A–D) Relative mRNA expression levels as determined by qPCR for (A) GYPC (only one single-cell–derived clonal line was analyzed: n = 1) (B) IL1B (n = 4), (C) IL1R2 (n = 3), and (D) VSIG1 (n = 3) are shown for unedited parental U2OS-GR cells (wt), for unedited clonal control cell lines, and for clonal cell lines with an integrated GBS at the target gene as indicated. Averages ± SEM for cell lines treated overnight with 1 μM dexamethasone (dex) or with ethanol (−) as vehicle control are shown. Dots show the values for each individual clonal line. Statistical tests were performed using an unpaired one-sided Mann–Whitney U test comparing each dex-treated group with its untreated counterpart. (E–H) GR occupancy at the edited genes was analyzed by ChIP followed by qPCR for cells as indicated treated with vehicle control (−) or 1 μM dex for 90 min. (E–H) Average percentage of input precipitated ± SEM from three independent experiments is shown for an unedited clonal control cell line and for a clonal cell line edited at either the (E) GYPC, (F) IL1B, (G) IL1R2, or (H) VSIG1 locus. Left panel shows binding at the edited promoter. Right panel binding at the unedited GILZ locus, which serves as control for comparable ChIP efficiencies between clonal lines. Statistical tests were performed using an unpaired one-sided Mann–Whitney U test comparing GR binding at the IL1R2 promoter between dex-treated clonal control and the dex-treated edited clonal line as indicated.

