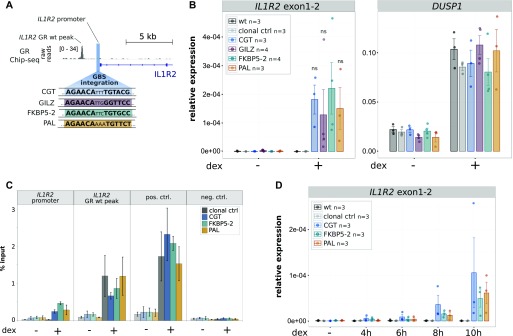
Figure 4. Comparison of IL1R2 activation levels by inserted GBS variants.
(A) Overview of the IL1R2 promoter region showing the location of the GBS integration, the sequence of integrated GBS variants, the GR ChIP-seq tag density for dex-treated U2OS-GR cells and the location of a GR ChIP-seq peak that is already present at the locus before editing (IL1R2 GR wt peak). (B) Relative mRNA expression levels as determined by qPCR for IL1R2 and for the unedited control GR target gene DUSP1 are shown for unedited parental U2OS-GR cells (wt), for unedited clonal control cell lines, and for clonal cell lines with an integrated GBS as indicated at the IL1R2 gene. Averages ± SEM for cell lines treated overnight with 1 μM dexamethasone (dex) or with ethanol (−) as vehicle control are shown. Dots show the values for each individual clonal line. Statistical tests were performed using an unpaired two-sided Mann–Whitney U test comparing the RNA level for dex-treated FKBP5-2 GBS samples with the dex-treated RNA levels for each of the other GBS variants analyzed. (C) GR occupancy was analyzed by ChIP followed by qPCR for clonal lines as indicated and treated with vehicle control (−) or 1 μM dex for 90 min. Average percentage of input precipitated ± SEM from three independent experiments is shown for the locus where the GBS was inserted (IL1R2 promoter), the IL1R2 wt peak, a positive control region (GILZ), and a negative control region (TAT). (D) Relative mRNA expression levels as determined by qPCR for the IL1R2 gene for unedited parental U2OS-GR cells (wt), for unedited clonal control cell lines and for clonal cell lines with an integrated GBS as indicated at the IL1R2 gene. Averages ± SEM for cell lines treated for 4, 6, 8, or 10 h with 1 μM dex or vehicle control (−) is shown. Dots indicate the value of each individual clonal cell line.

