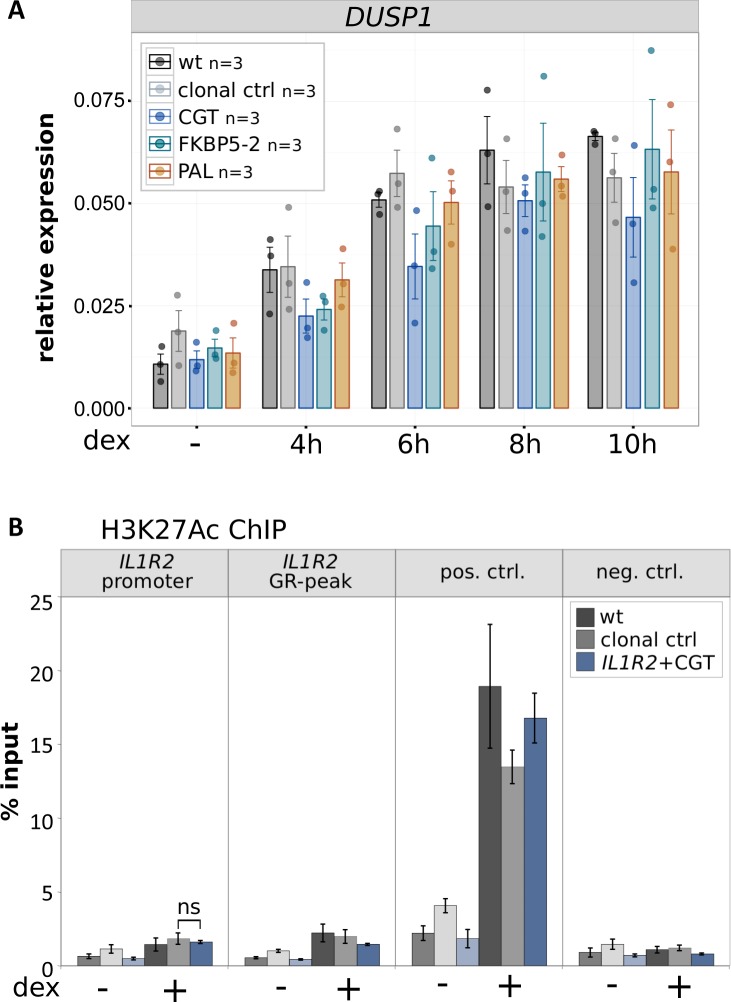
Figure S3. Induction of the unedited DUSP1 control gene and H3K27ac ChIP for clonal lines edited at the IL1R2 locus.
(A) Relative mRNA expression levels as determined by qPCR for the unedited DUSP1 gene for unedited parental U2OS-GR cells (wt), for unedited clonal control cell lines, and for clonal cell lines with an integrated GBS as indicated at the IL1R2 gene. Averages ± SEM for cell lines treated for 4, 6, 8, or 10 h with 1 μM dex or vehicle control (−) is shown. Dots indicate the value of each individual clonal cell line. (B) H3K27ac occupancy was analyzed by ChIP followed by qPCR for clonal lines and parental U2OS-GR cells (wt) as indicated treated with vehicle control (−) or 1 μM dex for 90 min. Average percentage of input precipitated ± SEM from three independent experiments is shown for the locus where the GBS was inserted (IL1R2 promoter), the IL1R2 wt peak, a positive control region (GILZ), and a negative control region (TAT). Statistical tests were performed using an unpaired two-sided Mann–Whitney U test comparing the H2K27ac levels at the IL1R2 promoter between dex-treated clonal control and the dex-treated IL1R2 + CGT clonal line.

