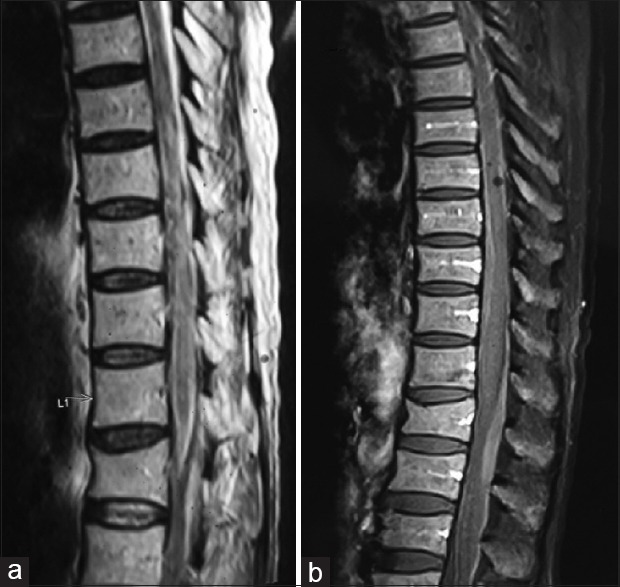
Figure 13.

(a) Magnetic resonance imaging T1-weighted sagittal image showing diffuse hypointense signals with in the parenchyma of the spinal cord of T11–L1. The cord is also seen expanded in this region. (b) Contrast image showing no contrast enhancement of the lesion
