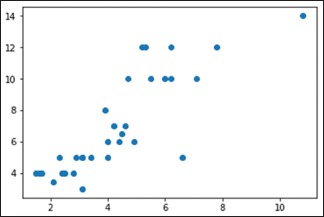
Chart 5.

Scatter diagram showing correlation between aneurysm height and size with age of the population and complication with Glasgow outcome scale of the unruptured anterior communicating artery aneurysm

Scatter diagram showing correlation between aneurysm height and size with age of the population and complication with Glasgow outcome scale of the unruptured anterior communicating artery aneurysm