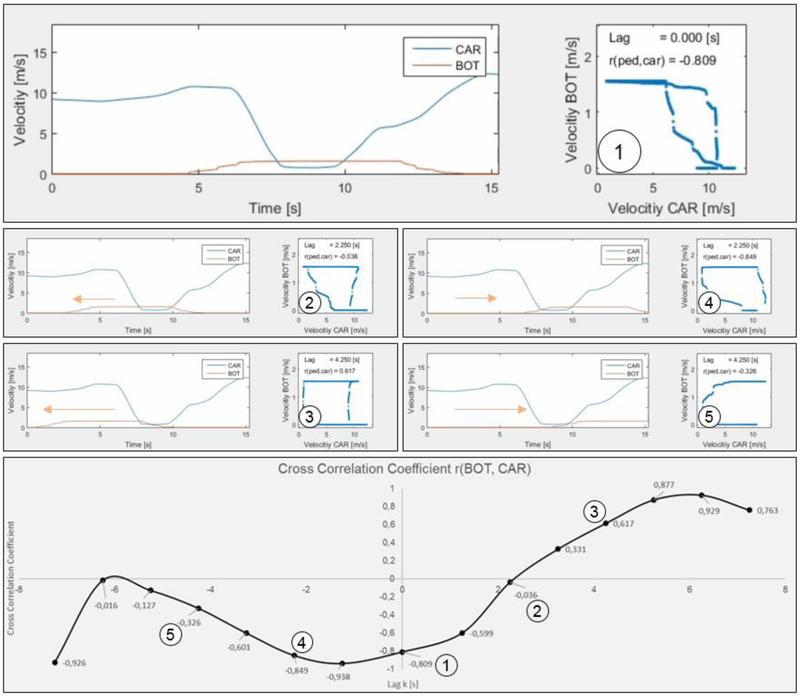
Figure 5:
Time-series analysis. The speed signals of the road users (Car and PED or BOT) are the basis of the cross correlation in the respective crossing situations. The figure shows the data for one subject in one crossing situation. Upper chart①: The two speed signals of the subject's car and the pedestrian (BOT), not shifted against each other (Lag = 0 s). Middle left charts ② and ③: plots with positive Lag = 2.25 s and 4.25 s and corresponding correlation (r = −0.36 and r = 0.617). Middle right charts ④ and ⑤: the same two speed signals shifted negatively against each other for 2.25 s and 4.25 s with r= −0.849 and r = −0.326. Lower chart: Complete cross correlation graph for selected Lags and correlations with the highest (negative) value for r (−0.938) at around −1 s.

