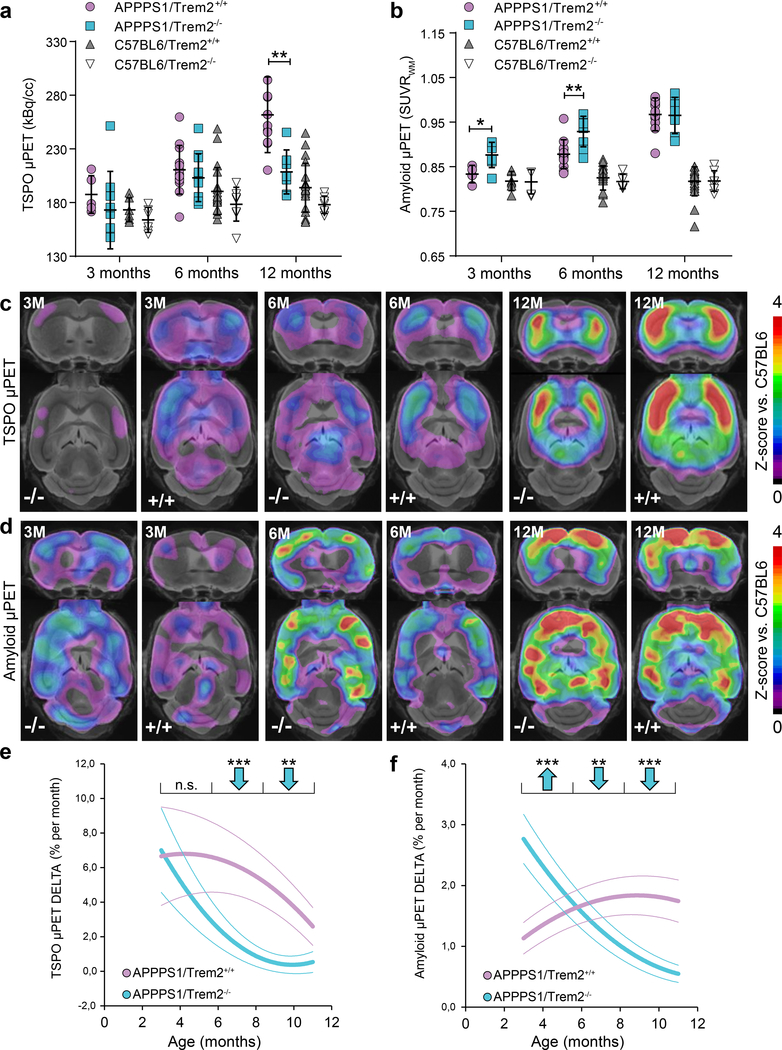
Figure 3. Increased amyloidogenesis in young Trem2 deficient mice is followed by lower amyloid accumulation rates during aging.
(a) Cortical microglial activity measured by in vivo TSPO μPET at ages of three (p=0.418), six (p=0.426) and twelve months (p=0.002) for Trem2 deficient APPPS1 mice compared to APPPS1/Trem2+/+. Age matched results for C57BL6 mice with and without Trem2 deficiency are implemented for comparison with mice lacking amyloid pathology. (b) Corresponding results for cortical fibrillar amyloidogensis assessed by in vivo Amyloid μPET at three (p=0.026), six (p=0.007) and twelve months (p=0.895). (APPPS1: three months Aβ PET n+/+=4 mice, TSPO PET n+/+=5 mice, Aβ PET n−/−=7 mice, TSPO PET n−/−=9 mice; six months Aβ PET n+/+=12 mice, TSPO PET n+/+=13 mice, Aβ PET n−/−=9 mice, TSPO PET n−/−=11 mice; twelve months Aβ PET n+/+=11 mice, TSPO PET n+/+=11 mice, Aβ PET n−/−=7 mice, TSPO PET n−/−=7 mice. C57BL6: three months Aβ PET n+/+=6 mice, TSPO PET n+/+=6 mice, Aβ PET n−/−=5 mice, TSPO PET n−/−=6 mice; six months Aβ PET n+/+=25 mice, TSPO PET n+/+=20 mice, Aβ PET n−/−=6 mice, TSPO PET n−/−=8 mice; twelve months Aβ PET n+/+=21 mice, TSPO PET n+/+=20 mice, Aβ PET n−/−=7 mice, TSPO PET n−/−=7 mice). Error bars represent mean ± SD. Two-sided t-test. (c) Coronal and axial slices show Z-scores of increased TSPO μPET against age matched C57BL6 (n=18 mice) to compare APPPS1/Trem2−/− and APPPS1/Trem2+/+ at three, six and twelve months of age using an MRI template. (d) Coronal and axial slices show Z-scores of increased Amyloid μPET against age matched C57BL6 (n=18 mice) to compare APPPS1/Trem2−/− and APPPS1/Trem2+/+ at three, six and twelve months. (e) Serial imaging shows distinctly lower monthly increases for TSPO μPET during aging (6–12 months) in APPPS1/Trem2−/− mice compared to APPPS1/Trem2+/+ mice (n+/+=11 mice, n−/−=11 mice, 3–5 months p=0.756, 6–8 months p=8.03E-7, 9–11 months p=0.003). (f) Serial Amyloid μPET indicates an increased accumulation rate of fibrillar amyloidogenesis in young APPPS1/Trem2−/− mice (3–5 months) compared to age matched APPPS1/Trem2+/+ mice. Importantly, the accumulation rate of fibrillar amyloid in APPPS1/Trem2−/− mice declines below those of APPPS1/Trem2+/+ during aging (6–12 months) n+/+=10 mice, n−/−=9 mice, 3–5 months p=1.52E-4, 6–8 months p=0.003, 9–11 months p=1.48E-4). Thick lines in e and f represent polynomic functions of longitudinal changes, whereas dotted lines represent functions of SEM. Two-sided t-test. *p<0.05; **p<0.01; ***p<0.001.

