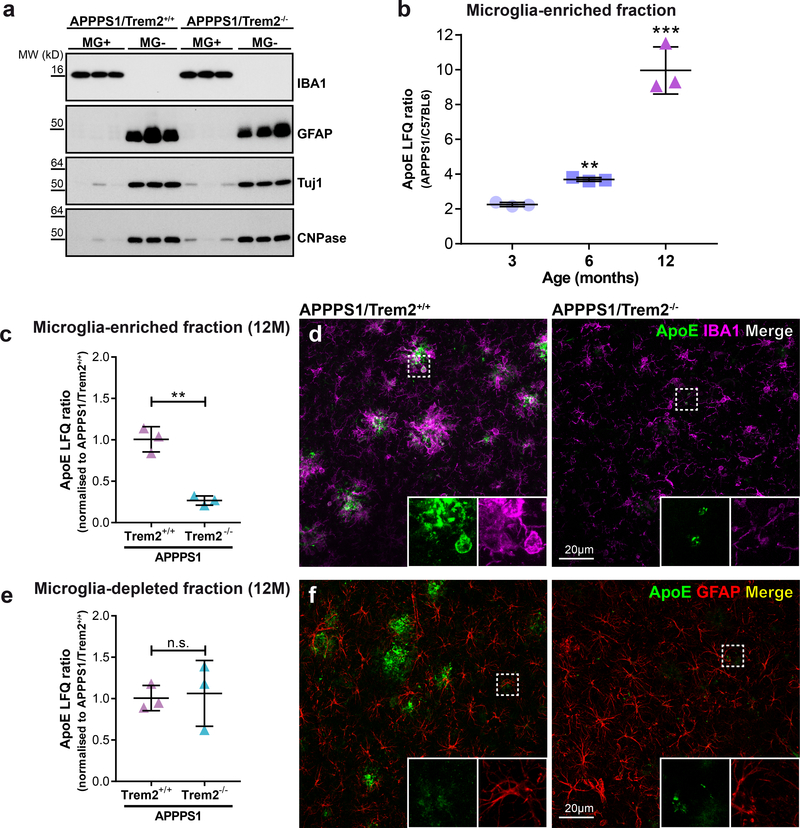
Figure 4. Relative protein quantification of ApoE in microglia-enriched and microglia-depleted lysates using mass spectrometry and label free quantification (LFQ).
(a) Immunoblotting of microglia-enriched (MG+) and microglia-depleted (MG-) lysates from twelve months old APPPS1/Trem2+/+ and APPPS1/Trem2−/− mice. Brain cell types in each fraction were identified by detection of IBA1 for microglia, GFAP for astrocytes, Tuj1 for neurons and CNPase for oligodendrocytes. Full image of each immunoblot is shown in Supplementary Fig. 7. (b) ApoE LFQ intensities of microglia-enriched lysates APPPS1/Trem2+/+ mice compared to age matched C57BL6 controls. Two-sided Student’s t-test comparing log2 transformed LFQ intensities of APPPS1 (n=3 mice) and C57BL6 (n=3 mice) separately for three (p=0.061), six (p=0.00372) and twelve months (p=1.78E-5) of age (**p<0.01; ***p<0.001). (c) ApoE LFQ intensities of microglia-enriched lysates from twelve months old APPPS1/Trem2−/− mice show significantly reduced ApoE compared to age matched APPPS1/Trem2−/− controls (n=3 mice/genotype). APPPS1 mice show significant reduction in ApoE after loss of Trem2 (p=0.00105). (d) ApoE and IBA1 costained in twelve months old APPPS1/Trem2+/+ and APPPS1/Trem2−/− mice. White boxes indicate the area in each staining that is magnified as inset. (e) Microglia-depleted lysates from twelve months old APPPS1 mice show no statistically significant changes regardless of Trem2 expression (n=3 mice/genotype; p=0.979). Data represent mean ± SD. (f) ApoE and GFAP costained in twelve months old APPPS1/Trem2+/+ and APPPS1/Trem2−/− mice. White boxes indicate the area in each staining that is magnified as inset.

